
NPS vs. CSAT vs. CES: Which Metric Should You Choose?
NPS, CSAT, and CES measure different things, and the real question in 2026 is not which one wins. It is when to layer a second metric on top of NPS, and when adding one just adds noise.
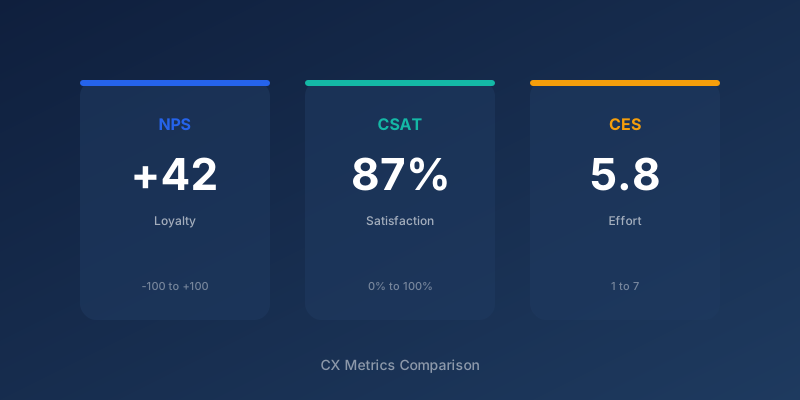
- NPS measures relationship health at the account level. CSAT measures satisfaction with one interaction. CES measures how much effort a customer spent to get something done.
- The real-world data does not support a "pick one and defend it" approach: CustomerGauge's 2026 B2B benchmark shows 49% of NPS users also track a second metric, most often CSAT (33%) or CES (about 1 in 6).
- CSAT and CES both lack standardised, cross-industry benchmarks. NPS is the only one of the three you can compare against a published industry number.
- Adding a second metric is not a sign your first one failed. It is usually a sign your programme matured past asking "are they happy" and started asking "where exactly does it break."
Contents7 sections
What Is the Difference Between NPS, CSAT, and CES?
NPS (Net Promoter Score) asks how likely a customer is to recommend you, on a 0-10 scale, and measures the health of the overall relationship. CSAT (Customer Satisfaction Score) asks how satisfied a customer was with one specific thing, usually scored on a 1-5 or 1-10 scale. CES (Customer Effort Score) asks how much effort it took to get a problem solved or a task done, and is the strongest of the three at predicting whether a customer disengages after a bad support experience.
The distinction that matters in B2B is not "better vs. worse." It is relationship vs. transaction. NPS tracks whether the account as a whole trusts you and plans to keep buying. CSAT and CES track whether one specific touchpoint, a support ticket, an onboarding step, a renewal call, went well. You need both kinds of data. You just do not need both kinds all the time, on everyone, at once.
When Should You Use NPS vs. CSAT vs. CES in B2B?
Start with NPS if you need one number that a board, a CFO, or a renewal-risk model can use. It is the only one of the three with published cross-industry benchmarks, so "our NPS is 42" means something a competitor comparison can use, unlike a CSAT of 88%, which depends entirely on your own scale and question wording.
Layer in CSAT once you have identified a specific touchpoint you want to manage: a support interaction, an onboarding milestone, a professional-services engagement. CSAT is fast, cheap, and good at flagging that something just went wrong, but it says almost nothing about whether the customer will renew.
Add CES when the touchpoint you are worried about is a process, not a person: self-service portals, procurement steps, integration setup. High effort in these moments predicts quiet disengagement long before a customer says anything negative in an NPS comment. Gartner's classic finding that 96% of high-effort customers become disloyal, against just 9% of low-effort ones, is why effort is the sharpest churn signal of the three.
Why "Pick One Metric" Is the Wrong Question
Most comparisons of NPS, CSAT, and CES frame the decision as a single choice: pick the metric that fits your business and commit to it. The data says B2B companies mostly do not work that way. CustomerGauge's 2026 NPS & CX Benchmarks Report found that 49% of NPS users also track at least one additional metric: over 33% add CSAT, and roughly 1 in 6 add CES on top (CustomerGauge, "NPS vs CES vs CSAT," April 2026).
That is the contraintuitive part. A company running NPS alone has not necessarily done something wrong, and a company running all three has not necessarily over-engineered its programme. The pattern in the data is layering, not competing: NPS gives the account-level verdict, CSAT explains a touchpoint, CES explains a process. Each answers a different question, so stacking them is closer to normal practice than the "choose your metric" framing suggests.
There is a second reason the single-metric framing is losing ground. Forrester's newer Total Experience Score work argues that leaning on any one legacy metric, NPS or CSAT included, in isolation increasingly misses what actually drives retention and brand perception (Forrester, CX Cast, "Just Another Number? Introducing Forrester's Total Experience Score," 2026). You do not need Forrester's specific framework to take the underlying point seriously: a single score, however well benchmarked, is a symptom tracker. It tells you something moved. It rarely tells you why, and it never tells you what to do next on its own, which is exactly where key driver analysis and text analytics on open comments earn their place in a programme.
NPS vs. CSAT vs. CES at a Glance
| Metric | What it measures | Best used for | Cross-industry benchmark available? |
|---|---|---|---|
| NPS | Overall account loyalty and relationship health | Executive reporting, renewal-risk, account health scoring | Yes - published yearly by CustomerGauge and Bain |
| CSAT | Satisfaction with one specific interaction | Support tickets, onboarding steps, professional-services delivery | No - scales and question wording vary too much across companies |
| CES | Effort required to complete a task or get help | Self-service, procurement, support process friction | No - no standardised benchmark exists |
Where CSAT and CES Fall Short in B2B
Neither CSAT nor CES was designed to answer the question your board actually asks: will this account renew and expand? CSAT reflects a moment, and a customer can rate a support interaction 5 out of 5 the same quarter they decide not to renew, because the interaction was fine but the product roadmap was not. CES predicts disengagement risk reasonably well, but it says nothing about whether the customer is a promoter you could turn into a reference or a passive you are about to lose.
That is also why neither has a standard benchmark the way NPS does. A CSAT of 80% at one company and 80% at another can reflect entirely different scales, sample sizes, and question phrasing, so cross-company comparison is close to meaningless. If you want a full breakdown of CSAT's specific strengths and blind spots, see our guide on what CSAT actually measures and where it misleads. The same caveat applies to CES, covered in our Customer Effort Score guide.
How to Combine All Three Without Drowning in Data
The programmes that layer metrics well do not survey everyone with everything. A workable B2B sequence looks like this: run relationship NPS quarterly across your account base to get the account-level signal and flag at-risk accounts. Run key driver analysis on the NPS data to find out which two or three things are actually moving the score, instead of guessing. Then deploy CSAT or CES only at the specific touchpoints that driver analysis flagged as weak, not as a blanket policy across every interaction.
Feed the open-text comments from all three surveys into AI text analytics so a low CES score on your onboarding flow and a Detractor comment about "too many logins to set up" get routed to the same product owner instead of sitting in two different spreadsheets. And weight the whole picture by account value: a Detractor comment from your largest account is not the same signal as one from a small, low-renewal-risk logo, which is the core idea behind account-based CX.
Take Nordika A/S as a hypothetical example: a mid-market logistics software vendor running relationship NPS twice a year across 140 accounts, transactional CSAT after every support ticket, and CES after every self-service portal session. Nordika does not report all three to its leadership team. It reports NPS and account health score. CSAT and CES exist purely to feed the health score and to give the customer success team an early flag on specific accounts, which is the layering pattern the data above actually supports.
Making the Metric Choice Pay Off
Choosing the right metric is only half the job. CustomerGauge's own benchmark work flags that 70% of B2B companies still do not tie their experience data to revenue at all (CustomerGauge, 2026), which means most programmes are collecting exactly the right signal and then failing to connect it to the renewal or expansion decision it should inform. Whichever combination of NPS, CSAT, and CES you land on, the metric only earns its keep once it is tied to an account, a revenue figure, and an owner who is accountable for acting on a bad score within days, not a quarterly report nobody reads.
Running NPS, CSAT, and CES in three separate tools is how most B2B teams end up with three separate spreadsheets and no single view of account health. SurveyGauge combines the measurement platform with the CX advisory to help you decide which metric to layer in, and when.
Frequently Asked Questions
Ready to know what your customers actually think?
SurveyGauge helps Nordic B2B companies move from gut feeling to data-driven CX decisions.
SurveyGauge Team
Customer Experience Experts
SurveyGauge-teamet hjælper virksomheder med at måle og forbedre kundetilfredshed via professionelle surveys, analyser og rådgivning.
You might also be interested in
View all articles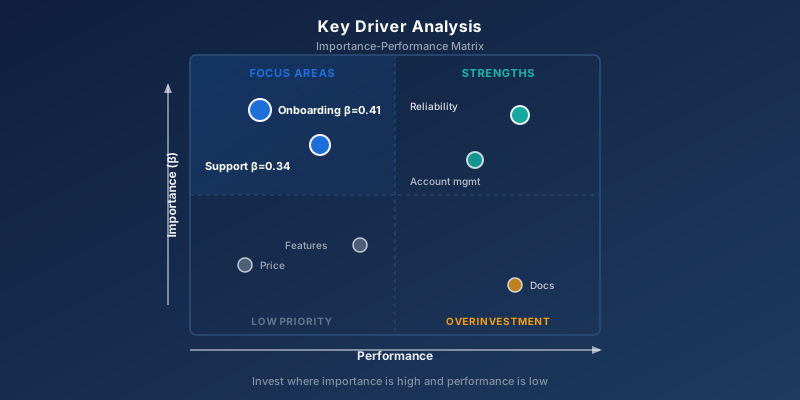
Key Driver Analysis: Find Out What Actually Moves Your NPS
NPS tells you THAT something is wrong. Key driver analysis tells you WHAT. Here is the method that turns a score into a prioritised action plan.
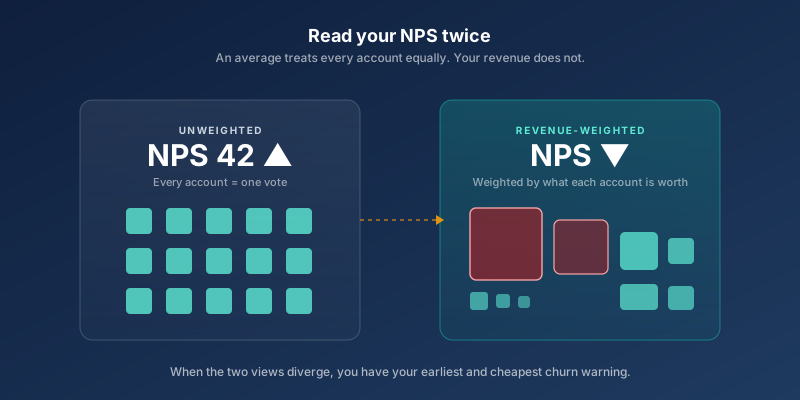
Account-Based CX: Run Your Feedback Programme on the Accounts That Pay the Bills
In most B2B companies a small share of accounts carries most of the revenue, yet every account gets the same survey and the same weight in the score. Account-based CX fixes that mismatch: weight feedback by account value, survey the whole buying group, and tier your follow-up.
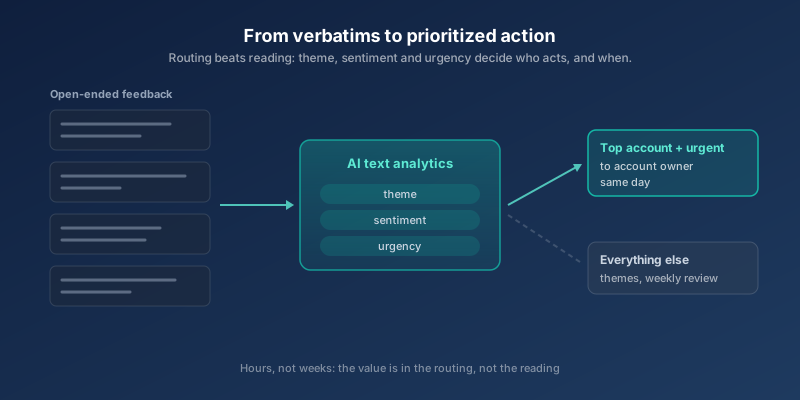
AI Text Analytics for Customer Feedback: From Verbatims to Prioritized Action
Most B2B teams buy AI text analytics to save analyst hours. The real return comes from something different: routing high-value, high-urgency feedback to the right owner in hours, not weeks.
![What Is NPS? The Complete Guide to Net Promoter Score [2026]](/img/knowledge/nps.svg)
What Is NPS? The Complete Guide to Net Promoter Score [2026]
NPS is the most widely used loyalty metric in the world, and also the most frequently misused. Indeed, the score means nothing without follow-up. Here is how to use it properly.
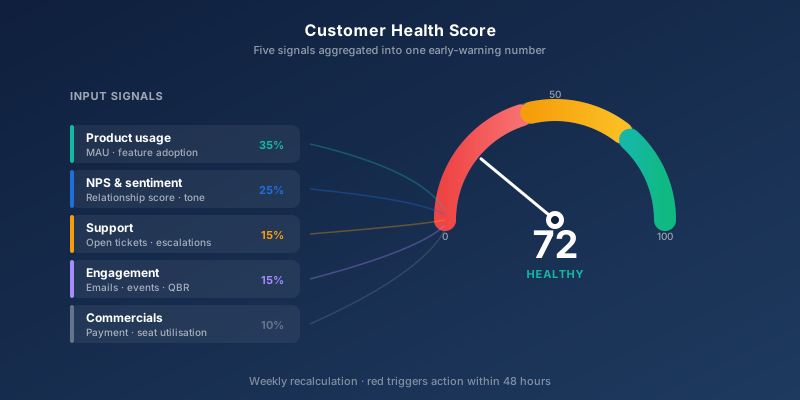
Customer Health Score: Build an Early Warning System for Churn
Customers decide to churn 60-90 days before the cancellation hits your CRM. A Customer Health Score surfaces the signal before you lose them. Here is how to build one that actually works.