
What Is CES? Customer Effort Score Explained
Customer Effort Score (CES) measures how hard it was for a customer to get something done. It predicts churn better than satisfaction does.
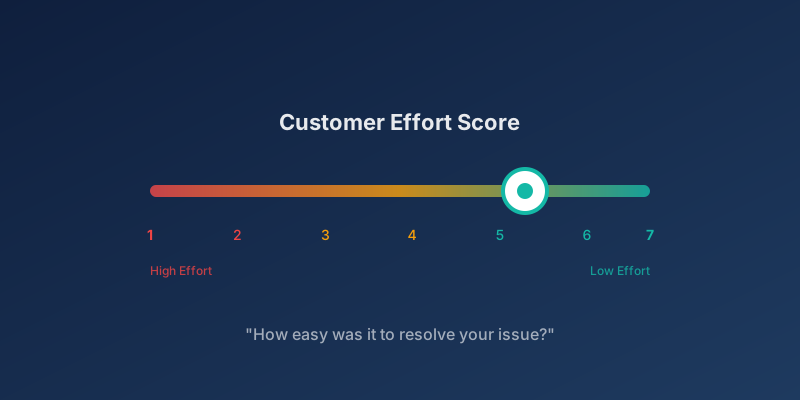
- CES measures effort, not happiness. That distinction matters because effort predicts churn far better than satisfaction does.
- Gartner's research is blunt: 96% of customers with high-effort experiences become disloyal. Delight is irrelevant if the basics are hard.
- Use CES at transactional touchpoints like support, checkout, and onboarding. It is not a relationship metric.
- In particular, among the B2B companies we work with, the ones tracking CES alongside NPS consistently find friction problems. These are issues that CSAT alone misses.
Contents11 sections
Customer Effort Score (CES) is a metric that measures how much effort a customer had to put in to get something done with your company, usually on a 1-7 scale. The lower the effort, the higher the loyalty.
Most CX programmes are built around a flawed assumption: that delighting customers is what keeps them. However, the research says otherwise. What actually drives loyalty is not exceeding expectations. Instead, it is removing the barriers that make normal interactions unnecessarily hard.
That is what Customer Effort Score measures. Not happiness. Not loyalty. Effort.
Where CES Came From, and Why It Matters
Matthew Dixon and his colleagues at CEB (now Gartner) published "Stop Trying to Delight Your Customers" in Harvard Business Review in 2010. The findings were uncomfortable for every company investing in "wow moments":
- 96% of customers with a high-effort service experience became more disloyal
- 88% of high-effort customers spread negative word of mouth
- Reducing effort was a stronger driver of loyalty than trying to exceed expectations
The implication is stark. Therefore, your priority should not be making things wonderful. It should be making things easy. Delight is a bonus. Ease is the foundation.
The CES Question
The standard CES question is a statement, not a question:
"The company made it easy for me to handle my issue."
Customers respond on a 7-point scale:
- 1 = Strongly disagree (high effort, bad)
- 7 = Strongly agree (low effort, good)
Common variants include "How easy was it to resolve your issue today?" with a difficulty scale. Either works, but pick one and stick with it. After all, changing the wording breaks your trend data.
Calculating CES
Straightforward:
CES = Average score of all responses
Five customers score 6, 7, 5, 4, and 6:
CES = (6 + 7 + 5 + 4 + 6) / 5 = 5.6
You can also segment responses into low effort (5-7), neutral (4), and high effort (1-3) to see the distribution. In fact, the distribution often tells you more than the average. A mean of 5.4 with 20% scoring 1-3 is a different situation than a mean of 5.4 with 5% in the danger zone.
Where CES Belongs (and Where It Does Not)
CES is a transactional metric. It measures friction at specific touchpoints. It is not a substitute for NPS as a relationship metric and it does not measure emotional satisfaction the way CSAT does.
Where CES works best
Customer support. This is CES territory. After every support interaction, whether chat, email, phone, or self-service, measure how hard it was to get help.
Checkout and payment flows. Cart abandonment is overwhelmingly caused by friction, not indecision. CES pinpoints whether your checkout is the problem.
Onboarding. Customers who struggle in the first weeks are at severe risk of quietly churning at renewal. CES tells you if onboarding is too complex before the customer tells you by leaving.
Returns and complaints. These are already negative experiences. Making them hard as well is a guaranteed path to losing the customer. CES here can preserve relationships that would otherwise end.
Self-service portals. If your knowledge base is supposed to reduce support load, CES tells you whether it actually does.
Where CES does not work
Do not use CES to measure overall brand perception, emotional connection, or long-term loyalty. Those are NPS and CSAT territory. CES is surgical, not strategic.
CES in B2B: Onboarding Is Where Effort Costs You the Contract
Most CES guidance is written for a single support ticket or a single checkout. In B2B, the highest-stakes moment for effort is earlier and longer: onboarding. Poor onboarding is responsible for roughly 23% of average customer churn (Retently, 2025), and it is also the easiest place to measure effort correctly, because the friction shows up in a handful of concrete steps: contract signature to first login, data migration, first successful use of the core feature, first invoice.
Map CES to each of those steps instead of asking one generic "how was onboarding" question at the end. This is the idea behind effort hotspots: specific stages in a journey where friction reliably piles up, rather than a single blended score that hides which step is actually the problem (Retently, 2026). A B2B onboarding survey built around milestones will surface exactly which hotspot to fix first.
The payoff compounds. Companies with consistently low-effort experiences report Net Promoter Scores that run roughly 65 points higher than companies with high-effort experiences (Retently, 2026). In an account book with a handful of large customers, closing one effort hotspot in onboarding can move the account-level number more than a general satisfaction campaign ever will.
Feed CES into two other systems rather than reading it alone. Combine it with usage and support-ticket data in a customer health score so a rising effort score is read alongside other churn signals, not in isolation. And run it through key driver analysis alongside NPS and CSAT to see whether effort is actually the metric moving your account-level loyalty, or whether you are fixing the wrong thing.
CES vs. CSAT vs. NPS
| Question | Best Metric |
|---|---|
| Will this customer recommend us? | NPS |
| Was this specific experience satisfactory? | CSAT |
| Was this process easy? | CES |
| Is this customer likely to churn? | CES |
| Which touchpoints need work? | CSAT + CES |
For the full comparison: NPS vs. CSAT vs. CES.
CES Benchmarks by Industry
CES benchmarks are less established than NPS benchmarks because the metric is younger and calculation methods vary. These figures are indicative on a 7-point scale:
| Industry | Typical CES Average |
|---|---|
| SaaS / Tech Support | 5.0-5.8 |
| E-commerce / Returns | 4.8-5.5 |
| Financial Services | 5.2-5.7 |
| Telecommunications | 4.5-5.2 |
| Healthcare | 5.0-5.5 |
Above 5.5 is solid. Below 4.5 is a clear signal that friction is actively driving customers away.
2026 context. CustomerGauge's 2026 research on B2B experience programmes found that CES is the least common companion metric to NPS: 49% of NPS users add at least one more metric, 33% choose CSAT, but only 1 in 6 add CES (CustomerGauge, 2026). That is not a reason to skip it. Effort is still one of the sharper predictors of churn we track. It does mean the benchmark data on CES is thinner than on NPS or CSAT, so treat any published "average CES" with real caution.
Here is the trap most CES dashboards fall into. A score of 5.2 out of 7 looks mediocre at first glance. Whether it actually is depends entirely on which way the scale runs. If your question is a statement like "The company made it easy for me to solve my problem," scored from Strongly Disagree (1) to Strongly Agree (7), then 5.2 is a solid result, above the midpoint and trending toward agreement. If instead you asked customers directly how much effort a task took, scored from 1 (very little effort) to 7 (a lot of effort), that same 5.2 is a warning sign. Before you compare your CES to anyone else's, or to your own number from last quarter, confirm which direction your own scale points. Teams that switch survey tools or rephrase a question mid-year have compared two incompatible numbers and drawn the wrong conclusion more than once.
What We See in Practice
Among the B2B companies we work with, a few patterns recur:
CES reveals problems that CSAT hides. A customer can report being "satisfied" with a support interaction that took three transfers and two days. The outcome was fine, but the effort was high. CSAT scores 4 out of 5. CES scores 2 out of 7. The CSAT score suggests everything is working. The CES score shows the process is broken.
Moreover, onboarding CES is the strongest early-churn predictor. Companies that measure CES at day 7 and day 30 of onboarding can intervene before the customer mentally disengages. By the time you send a quarterly NPS survey, a struggling customer has already decided to leave.
Self-service CES is consistently underused. Most companies build a knowledge base and assume it works. Measuring CES on self-service usage reveals whether customers actually find what they need, or whether they give up and call support anyway.
Common Mistakes with CES
Treating CES as a relationship metric. CES is transactional. Sending a CES survey once a quarter to your whole customer base makes no sense. Trigger it after specific interactions.
Only looking at the average. A CES of 5.2 sounds acceptable. Yet if 25% of respondents scored 1-3, you have a serious friction problem with a specific subset of customers. Always look at the distribution.
Not asking the follow-up question. A CES score tells you effort was high. It does not tell you why. Always include one open-ended question: "What could we have done to make this easier?" The open text that follows a CES question, "what made this difficult?", is usually richer than the score itself, and it is exactly the kind of high-volume, low-structure feedback an AI agent can triage as it arrives rather than in a quarterly batch. See AI text analytics for customer feedback and AI agents for customer satisfaction for how that works in practice.
Measuring without ownership. If nobody owns the CES score for a specific process, nobody improves it. Assign process owners before you start measuring.
Five Ways to Reduce Customer Effort
- Invest in self-service. Most customers prefer to solve problems themselves. A well-structured knowledge base, clear documentation, and an effective search function reduce effort for the customer and load for your support team.
- Remove unnecessary steps. Walk through your most important customer-facing processes and ask: can we remove a step here? Can we pre-fill this form? Can we eliminate this approval? Every extra step is effort, and effort drives churn.
- Reduce support handoffs. Being transferred from agent to agent is one of the highest-effort experiences a customer can have. Track first-contact resolution as a KPI and give agents the authority and tools to resolve issues without escalation.
- Communicate proactively. Shipping updates, status notifications, known-issue alerts. Every proactive message is a support ticket that never gets created. That is effort removed before the customer even notices.
- Optimise for mobile. A large and growing proportion of customer interactions happen on phones. If your flows are clunky on mobile, you are generating effort for the majority of your users. Test every critical process on mobile devices.
CES and Churn
This is the core argument for CES. Gartner's research found that:
- Customers with low-effort experiences had a 94% likelihood of repurchasing
- Low-effort customers were 88% likely to increase their spending
- High-effort customers were 4 times more likely to become disloyal than merely dissatisfied customers
Satisfaction does not retain customers. Ease does. Consequently, if you are serious about reducing churn, CES should be part of your measurement stack. Pair it with NPS for the strategic view and CSAT for touchpoint detail, and you have a complete picture.
For more on building a churn reduction strategy: How to Reduce Churn.
Frequently Asked Questions
Ready to know what your customers actually think?
SurveyGauge helps Nordic B2B companies move from gut feeling to data-driven CX decisions.
SurveyGauge Team
Customer Experience Experts
SurveyGauge-teamet hjælper virksomheder med at måle og forbedre kundetilfredshed via professionelle surveys, analyser og rådgivning.
You might also be interested in
View all articles![What Is NPS? The Complete Guide to Net Promoter Score [2026]](/img/knowledge/nps.svg)
What Is NPS? The Complete Guide to Net Promoter Score [2026]
NPS is the most widely used loyalty metric in the world, and also the most frequently misused. Indeed, the score means nothing without follow-up. Here is how to use it properly.

What Is CSAT? Guide to Customer Satisfaction Score
CSAT is the most direct satisfaction metric you can use, but it is also the most abused. Therefore, here is how to deploy it properly, when to trust it, and when it misleads.
NPS vs. CSAT vs. CES: Which Metric Should You Choose?
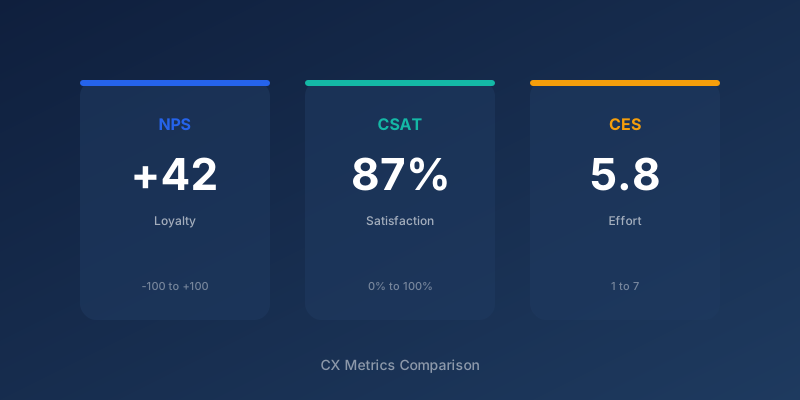
NPS, CSAT, and CES measure different things, and the real question in 2026 is not which one wins. It is when to layer a second metric on top of NPS, and when adding one just adds noise.
![How to Deliver Great Customer Service: Principles and Practice for B2B [2026]](/img/knowledge/customer-service.svg)
How to Deliver Great Customer Service: Principles and Practice for B2B [2026]
How do you deliver great customer service in B2B? The core principles, from First Contact Resolution to low effort done right, plus where AI self-service helps or erodes trust in 2026.