TL;DR
- The generic "you need 384 responses" rule assumes an infinite population. Apply it to a 40-account book of business and you will conclude the goal is impossible. It is not, because you are not sampling from infinity.
- For a reliable NPS at 90% confidence, plan for roughly 30 responses at plus-or-minus 25 points of precision, 48 at plus-or-minus 20 points, and 88 at plus-or-minus 15 points (MeasuringU's adjusted-Wald model).
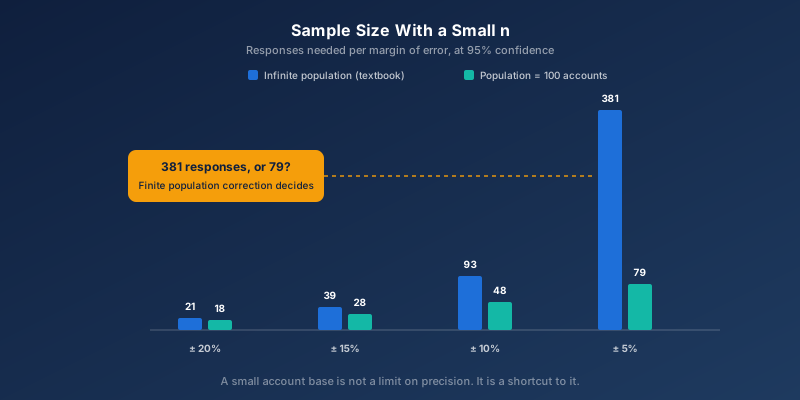
- Finite population correction (FPC) shrinks the required sample size once your responses cover a meaningful share of your account base. At a population of 100, the sample size needed for a plus-or-minus 10% margin of error at 95% confidence drops from 93 to 48, according to MeasuringU's published tables.
- Below roughly n=30, treat the score as directional, not decimal. Compare the trend and the pattern across metrics, not the exact number.
Contents6 sections
Ask a market research textbook how many survey responses you need, and it will tell you to collect 384. That number comes from a formula built for populations in the millions: consumers, voters, app users. Your B2B account base is not that population. If you sell to 40, 80 or 150 named enterprise customers, you are not sampling from infinity. You are close to running a census, and the statistics behave differently once you admit that.
How Many B2B Survey Responses Do You Actually Need?
The honest answer is: fewer than you have been told, if your total account base is small. B2B International's 2026 research on sample sizes puts it plainly: samples of n=30 to n=100 are not just acceptable in B2B research, they are "highly robust when designed and interpreted correctly," because business decision-maker populations are inherently smaller and more homogeneous than consumer audiences. A telecoms operator surveys millions of subscribers. You survey the finance director, the ops lead and the procurement manager at 60 named accounts. Different population, different math.
That does not mean any number of responses is fine. It means the target you should aim for depends on your actual account count, not a number lifted from a consumer market research course. The rest of this article works through exactly how to calculate that target.
Why Does the Standard Sample-Size Formula Break Down for B2B?
Every sample-size formula you find in a statistics textbook, including the simple n = Z²/d² rule, assumes you are drawing a small fraction of an effectively infinite population. That assumption holds for a consumer NPS programme surveying a fraction of two million subscribers. It does not hold when your "population" is 40 companies you can list by name in a spreadsheet.
When you ignore that difference, two things go wrong. First, you demand a sample size that is mathematically impossible: no formula built for infinite populations will ever tell you that 25 responses out of 40 accounts is enough, because it was never designed to know your population has an edge. Second, you interpret a small n as automatically unreliable, when in a small population a "small" n might represent 50-70% of everyone who could possibly respond. That is closer to a census than a survey, and censuses do not need the same precision buffer as samples.
The fix is a statistical technique built for exactly this situation: the finite population correction.
What Is Finite Population Correction, and Why It Works in Your Favor
The finite population correction (FPC) adjusts your standard error to account for how much of your total population your sample actually covers. The formula is the square root of (N minus n) divided by (N minus 1), where N is your population size and n is your sample size. You multiply this factor into your standard error and, by extension, your margin of error.
The mechanism is intuitive once you see it: if you have already heard from a large share of everyone who could respond, there is less unknown left to estimate. MeasuringU's research on the FPC found that the correction "really kicks in" once your sample size passes roughly 10% of the population, and the benefit grows fast from there. For small populations, that threshold arrives almost immediately: even 10 responses out of a population of 100 already represents a 10% share.
Here is the concrete effect on required sample size. MeasuringU published sample-size tables comparing the standard, uncorrected calculation against the FPC-adjusted calculation for populations of 100 and 500, using a 95% confidence adjusted-Wald model for binary outcomes (the same family of statistics used for NPS and completion-style metrics):
| Target margin of error | Sample size needed (infinite population) | Sample size needed (population = 100) |
|---|---|---|
| ± 20% | 21 | 18 |
| ± 15% | 39 | 28 |
| ± 10% | 93 | 48 |
| ± 5% | 381 | 79 |
Read the bottom row again. The textbook formula says you need 381 responses for a tight, plus-or-minus-5% margin of error. If your actual population is 100 accounts, you need 79, and you are sampling 79% of your entire customer base to get there. That is the trade B2B teams almost never realize they are allowed to make: your small population is not a limitation on precision, it is a shortcut to it.
Take a hypothetical illustration. Nordika A/S runs a relationship NPS across its full account base of 40 named enterprise customers and collects 25 completed responses, a 63% response rate that is well within reach for a relationship-driven B2B programme (CustomerGauge's B2B benchmark puts the industry average NPS response rate at 12.4%, with top-performing clients regularly clearing 60%). Applying the FPC formula to N=40 and n=25 gives a correction factor of roughly 0.62: the standard error, and therefore the margin of error, shrinks to about 62% of what the generic infinite-population formula would predict. Nordika's CX lead is working with meaningfully tighter precision than a standard lookup table would suggest, precisely because the account base is small.
How Do You Read an NPS When n Is Below 30?
Not every B2B programme can or should chase 79% response rates. If your active sample sits below roughly 30 responses, per-survey precision is genuinely limited, no matter how you correct for population size. MeasuringU's adjusted-Wald model puts the 90%-confidence margin of error at around plus-or-minus 25 points with n=30. That is a wide band for a metric usually discussed to the single point.
The practical response, per B2B International's 2026 guidance, is to change what you ask the data to do. Treat scores below n=30 as directional indicators, not decimal-point measurements: watch whether the trend moves consistently in one direction over two or three survey cycles, rather than debating whether this quarter's score really moved 4 points. Look for agreement across metrics. If NPS, renewal intent and support ticket sentiment all point the same way, that consistency is worth more than any single score's confidence interval. And resist the urge to slice a 25-response sample into segments by region or buying committee role. Splitting an already-small sample into smaller ones is the fastest way to manufacture noise you will mistake for a signal.
The same caution applies to the analysis you run on top of the score. Key driver analysis recommends at least 150 respondents before its driver ranking is stable, which is well above what most small-n B2B programmes ever collect in a single wave. Below that, the beta weights swing between runs, so treat a driver ranking from a thin sample the same way you treat the score itself: as a direction to investigate, not a priority list to fund.
This is also where a disciplined survey design process pays for itself: a short, well-timed questionnaire that maximizes completion is worth more, statistically, than a long one that depletes your response rate and shrinks n further. If response rate itself is your bottleneck, the mechanics of getting from the industry's 12.4% average toward the 60%+ range top B2B performers reach are covered in our guide to improving survey response rate.
What This Means for Your Account-Based CX Programme
Small-n statistics are not a B2B liability to apologize for. They are the reason account-based CX works differently from consumer CX in the first place: when your total population is countable, every single response carries more statistical weight than it would in a programme surveying thousands. That is an argument for surveying every account, not a sample of them, and for tracking response rate per account as carefully as you track the score itself. The same holds for CSAT: a handful of touchpoint responses per account is a direction, not a measurement.
It also changes what "how do I measure customer satisfaction properly" means in practice. Our guide on how to measure customer satisfaction covers metric choice and cadence; this article is the missing piece underneath it, how many of those measurements you actually need before you trust the number. And if the question you are really asking is "is my NPS good," start with what a defensible baseline looks like at your scale in our NPS benchmarks guide before you worry about the decimal point.
Where SurveyGauge Fits
SurveyGauge's platform tracks completion and response rate at the account level alongside the score itself, so your CX team sees precision next to the number, not just a number and a color. That is the difference between reporting an NPS and being able to defend one when a board member asks how sure you actually are.
Want survey and CX benchmarks that hold up statistically at your account count, not just a score on a dashboard? Get a Free Demo or see pricing.
Frequently asked questions
How many survey responses do I need for a reliable NPS in B2B?
It depends on your total account base, not a fixed number. Per MeasuringU's adjusted-Wald model, plan for roughly 30 responses for a wide plus-or-minus 25-point margin at 90% confidence, 48 for plus-or-minus 20 points, and 88 for plus-or-minus 15 points. If your total population is small (under a few hundred accounts), the finite population correction reduces these targets further, sometimes substantially.
What is finite population correction, and why does it matter with 40 accounts?
Finite population correction (FPC) adjusts your margin-of-error calculation to reflect how much of your total population your responses actually cover. The standard formulas assume you are sampling from an effectively infinite population; when your real population is 40 or 100 named accounts, ignoring FPC overstates your true uncertainty and can make an achievable target look statistically impossible.
Can I trust an NPS based on only 15-20 responses?
Treat it as directional, not precise. At that sample size the margin of error is wide (often 25+ points at typical confidence levels), so a single quarter's exact number is unreliable. What is trustworthy is a consistent direction across two or three survey cycles, and agreement between NPS and other signals like renewal intent or support sentiment.
What is the difference between margin of error and statistical significance?
Margin of error tells you the range within which your true population score likely falls, given your sample. Statistical significance tells you whether a specific difference, for example between this quarter and last quarter, is large enough to rule out random sampling noise as the explanation. You need both: a score can sit within a wide margin of error and still show a significant change if the shift is large enough.
Should I segment my data if I only have a small sample?
Be cautious. Splitting an already-small sample by region, industry or buying-committee role multiplies your uncertainty in each segment. B2B International's guidance is to define your core segments upfront, based on what actually drives decisions, rather than slicing data after the fact to see what shows up.
How does response rate affect my effective sample size?
Directly: your effective n is however many completed responses you collect, not the size of your account base. A 40-account programme with a 40% response rate is working with n=16, not n=40. Since B2B response rates average 12.4% industry-wide but top performers clear 60%+, closing that gap is often the single highest-leverage lever for improving the statistical reliability of your CX programme, alongside sound survey design.
When is my B2B customer base really a census rather than a sample?
Once your completed responses cover roughly 50% or more of your total account base, you are closer to measuring the whole population than estimating from a slice of it. At that point, the finite population correction is doing significant work, and your effective precision is meaningfully tighter than the standard uncorrected formulas suggest.

Written by
SurveyGauge Team
The advisors and developers behind SurveyGauge. We run customer satisfaction programmes for B2B companies, from 20 key accounts to global banks.