
The 6 Pillars of Customer Experience: What Drives Loyalty and NPS
KPMG's Customer Experience Excellence report identifies six universal drivers behind NPS and loyalty, weighted from 80,594 interviews. Integrity and Personalization combined drive 39% of loyalty, and B2B buying committees make Personalization structurally harder than in B2C.
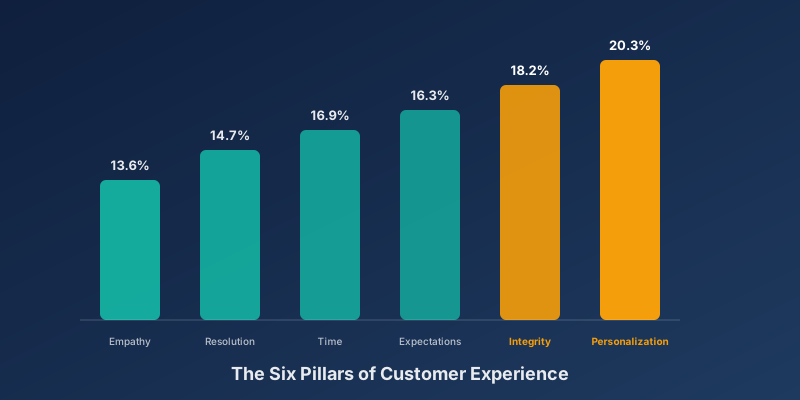
- KPMG's CEE 2025-2026 report is based on 80,594 interviews across 2,684 brands in 16 countries.
- Integrity (19.0%) is the strongest driver of NPS, while Personalization (20.3%) drives loyalty most. Together they explain 39% of total loyalty.
- Counterintuitive: the "average B2B buying committee" is not one fixed number. It scales with deal size, from 6-10 stakeholders in a typical mid-market deal (Gartner) to 13 in the average B2B purchase overall (Forrester), which is exactly why Personalization is structurally harder to execute in B2B than in B2C.
- Banking ranks 4th globally with a CEE score of 7.52, driven by empathy and expectations management.
Contents12 sections
KPMG's Global Customer Experience Excellence (CEE) 2025-2026 report is the world's most comprehensive CX benchmark. Based on 80,594 interviews across 2,684 brands in 16 countries, it identifies six universal drivers of customer experience and weights them against real commercial outcomes.
This article breaks down the six pillars, their relative weight, and what each one means for your CX strategy.
The Six Pillars and Their Weight
Here is the relative importance of each pillar as a driver of NPS and loyalty respectively:
| Pillar | NPS Driver | Loyalty Driver |
|---|---|---|
| Integrity | 19.0% | 18.2% |
| Personalization | 18.7% | 20.3% |
| Expectations | 16.9% | 16.3% |
| Time & Effort | 15.2% | 16.9% |
| Resolution | 15.2% | 14.7% |
| Empathy | 15.0% | 13.6% |
The key takeaway: Personalization and Integrity combined are the strongest drivers of commercial outcomes.
- NPS driver
- Loyalty driver
- Personalization18.7%20.3%
- Integrity19%18.2%
- Time & Effort15.2%16.9%
- Expectations16.9%16.3%
- Resolution15.2%14.7%
- Empathy15%13.6%
Integrity: The Strongest NPS Driver (19.0%)
Integrity is about honesty, transparency and fair treatment. Trust, in practice. Companies that score high on Integrity have clear, transparent pricing and terms, deliver on their promises consistently, treat customers fairly even when problems arise, and take responsibility for mistakes rather than explain them away.
In complex B2B relationships, where contracts are large and decisions involve many stakeholders, trust is not a nice-to-have. It is the foundation the entire relationship sits on. According to the report, Integrity is the single strongest predictor of CX excellence, and it is the pillar B2B buyers are least willing to forgive a lapse on.
Personalization: The Strongest Loyalty Driver (20.3%)
Using a customer's name in an email is not personalization. That is automation. Real personalization means demonstrating understanding of a customer's specific situation and adapting the experience accordingly. KPMG's report ties this to three requirements: a unified customer view across front, middle and back office, AI-powered analysis that identifies individual needs and preferences, and proactive action based on customer context rather than reactive response.
Why this is structurally harder in B2B: the average B2B purchase involves 13 stakeholders (Forrester, 2024), while a typical mid-market buying committee runs 6-10 people (Gartner, 2024), each arriving with their own independently gathered information. Neither number is wrong. Committee size scales with deal value, not the other way around. But the practical consequence is the same either way: personalization aimed only at your main contact will feel generic to the other five to twelve people in the room, because it is.
Expectations: The Gap Has Never Been Smaller (16.9% NPS / 16.3% Loyalty)
The Expectations pillar is about managing, meeting and exceeding customer expectations. KPMG notes that the gap between Expectations and Integrity has never been smaller (just 0.2%), which signals that expectations management is rising in importance. Companies that master this pillar set clear expectations from the start, communicate proactively about changes and delays, and deliver consistently across channels and touchpoints.
Time & Effort: The Fastest-Growing Driver (15.2% NPS / 16.9% Loyalty)
Time & Effort shows the largest increase in importance of any pillar, up 0.4 percentage points year-over-year. Customers want frictionless experiences. Retail performs best on this pillar, 2.4% above the market average, while utilities and logistics lag roughly 5% below the norm. Digitalization and AI are the primary drivers of the improvement seen elsewhere.
Resolution: From Detractors to Promoters (15.2% NPS / 14.7% Loyalty)
Resolution is about what happens when things go wrong. KPMG's data shows effective resolution can turn detractors into promoters. The best companies treat service recovery as a designed experience, not an ad hoc process. In Australia, Resolution improved 3.5% year-over-year, the second-largest gain of any pillar.
Closing the loop on every response, especially from dissatisfied customers, is the single most direct path to strengthening the Resolution pillar. It is a discipline, not a courtesy gesture.
Empathy: The Most Underrated Pillar (15.0% NPS / 13.6% Loyalty)
Empathy is often the missing pillar in underperforming sectors, yet one of the strongest drivers of perceived value and long-term connection. In Australia, Empathy showed the largest improvement of any pillar this year: +4%.
As AI takes on more routine interactions, the empathetic dimension of the interactions that remain human becomes more important, not less. An AI response that lacks empathy is just a faster form response, and customers notice the difference.
What We See in Practice
Across the Nordic B2B companies we work with, three patterns show up repeatedly.
Companies that only measure NPS are flying blind. They know the score is low, but not why, so they end up funding initiatives that rarely hit the actual problem.
Companies that understand the pillars but never act on them end up with detailed analysis and no improvement. Data without action is a research exercise, not a CX programme.
Companies that connect the pillars to action know exactly which dimension is dragging their NPS down, prioritise accordingly, and can point to the result. That is the group that actually moves the number.
Sector Scores: Where Does Your Industry Stand?
| Sector | CEE Score |
|---|---|
| Healthcare | 7.90 |
| Non-Grocery Retail | 7.65 |
| Grocery Retail | 7.54 |
| Banking | 7.52 |
| Insurance | 7.48 |
| Restaurants/Fast Food | 7.46 |
| Travel & Hotels | 7.42 |
| Automotive | 7.37 |
| Telecommunications | 7.28 |
| Logistics | 7.07 |
| Utilities | 7.02 |
| Public Sector | 6.68 |
Banking ranks 4th globally with a score of 7.52, up 0.7% year-over-year, driven primarily by improvements in Empathy (+1.4%) and Expectations (+1.3%). See our deeper breakdown in CX in Financial Services. An NPS of 30 is strong in telecoms and mediocre in retail. Context, and the sector table above, is what tells you which one applies to you.
- Healthcare7.9
- Non-Grocery Retail7.65
- Grocery Retail7.54
- Banking4th globally, +0.7% YoY7.52
- Insurance7.48
- Restaurants/Fast Food7.46
- Travel & Hotels7.42
- Automotive7.37
- Telecommunications7.28
- Logistics7.07
- Utilities7.02
- Public Sector6.68
Total Experience: The Next Evolution
KPMG introduces Total Experience as the overarching framework: the integration of customer, employee, partner and digital touchpoints into one coherent whole, built on five principles.
- Customer centricity - design around customer needs, values and goals
- Data-driven insights - turn data into actionable intelligence
- Seamless integration - unify data, systems, channels and journeys
- Employee empowerment - equip teams with tools, insight and autonomy. This is where the customer and employee sides meet: eNPS sets a ceiling on customer experience, because disengaged teams cannot deliver on any of the six pillars for long
- Technology enablement - make technology the invisible backbone
- Total Experience
- IntegrityTrust, transparency, fair treatment
- PersonalizationUnderstanding the specific situation
- ExpectationsSetting, meeting, exceeding
- Time & EffortRemoving friction
- ResolutionRecovery as a designed experience
- EmpathyThe human dimension AI cannot fake
What Does This Mean for Your CX Strategy?
1. Measure the pillars that drive your business
Do not rely on NPS as a standalone number. A five-point drop can come from a trust problem (Integrity) or a friction problem (Time & Effort). The fix is different in each case, so find out which one you actually have.
2. Prioritize Integrity and Personalization
Together they drive about 39% of total loyalty. Invest in trust (transparency, consistency) and in personalization that reaches the whole buying committee, not just your main contact.
3. Reduce friction in your own CX programme
Your feedback process should itself score high on Time & Effort. Automate the administrative work, and spend your time on action and advisory instead.
4. Build Close the Loop as a core discipline
Resolution requires systematic follow-up. Design your process so every dissatisfied customer is contacted and every pattern leads to a concrete fix.
5. Do not underestimate empathy
Especially in B2B, where relationships are long-term and complex, the empathetic dimension is critical for customer retention.
How SurveyGauge Helps
SurveyGauge's model of Platform + Administration + Advisory is built to deliver on exactly the dimensions KPMG highlights: advisors who help you close trust gaps (Integrity), AI-powered analysis that spots individual patterns (Personalization), an administration layer that removes friction from your own programme (Time & Effort), automated close-the-loop flows so no dissatisfied customer goes unnoticed (Resolution), and strategic sparring that keeps the human dimension central (Empathy).
Source: KPMG Global Customer Experience Excellence 2025-2026, "Total Experience: Redefining excellence in the age of agentic AI". Buying committee data: Gartner (2024) and Forrester (2024, via 6sense).
Frequently Asked Questions
Ready to know what your customers actually think?
SurveyGauge helps Nordic B2B companies move from gut feeling to data-driven CX decisions.
SurveyGauge Team
Customer Experience Experts
SurveyGauge-teamet hjælper virksomheder med at måle og forbedre kundetilfredshed via professionelle surveys, analyser og rådgivning.
You might also be interested in
View all articles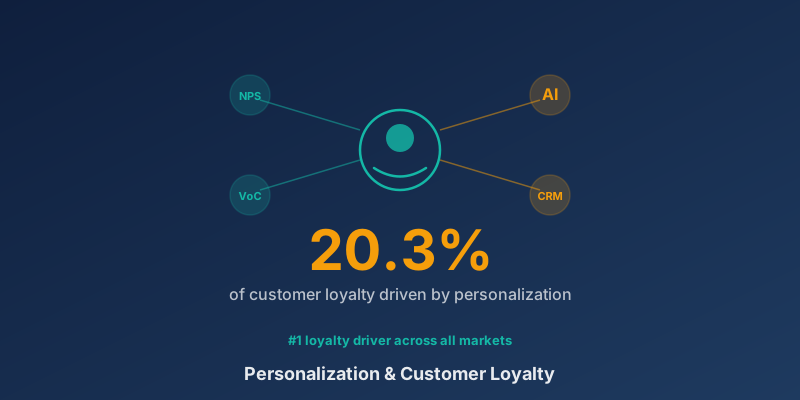
Personalization Drives 20% of Customer Loyalty: What It Means for Your CX Strategy
Personalization drives the single largest share of customer loyalty in KPMG's global CX benchmark. But Gartner's 2025 data shows it backfires for over half of customers when it feels like surveillance rather than help. Here is how to get it right in B2B.
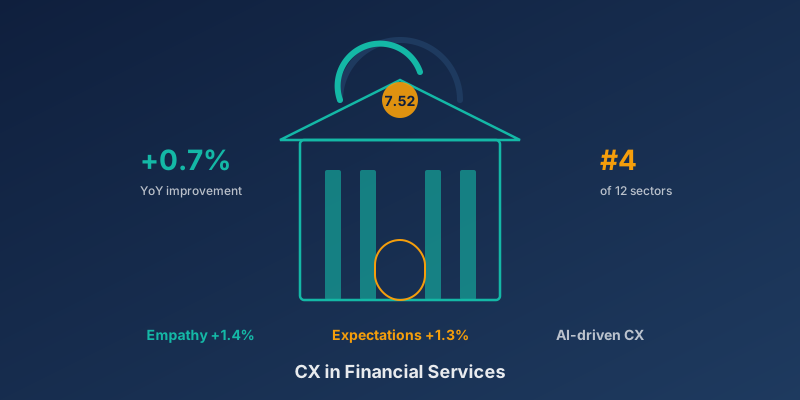
CX in Financial Services: Banking, Empathy, and Personalization
Banking ranks 4th globally in KPMG's benchmark, but that ranking is built on retail interactions. CustomerGauge's 2026 NPS data tells a different story for B2B: banking specifically sits at 30, well below the sector average of 44, and relationship-driven sub-sectors consistently outperform it.
AI and Customer Experience in 2026: From Agentic AI to Anticipatory CX
KPMG's global CX benchmark shows 55% of CEOs rank AI as their top investment priority. A newer KPMG pulse survey shows the real divide isn't model quality, it's whether the CEO is actually accountable for AI-driven decisions.
![What Is a Good Customer Experience? The Key Drivers in B2B [2026]](/img/knowledge/good-cx.svg)
What Is a Good Customer Experience? The Key Drivers in B2B [2026]
What is a good customer experience in B2B? A concrete definition, the six drivers that determine it, why buying committees make "good" relative, and a model for building and measuring it systematically.
![How to Build Customer Loyalty: Strategies That Drive Loyal B2B Customers [2026]](/img/knowledge/customer-loyalty.svg)
How to Build Customer Loyalty: Strategies That Drive Loyal B2B Customers [2026]
How do you build customer loyalty in B2B? Why satisfied customers still leave, the real drivers, and the concrete moves that turn accounts into advocates.