
eNPS and Customer Experience: Why Employee Loyalty Sets the Ceiling on Your CX [2026]
In B2B, a handful of named account managers and support engineers are the relationship. Their engagement sets a ceiling on the experience your customers can have. eNPS is the cheapest early warning for that ceiling, if you stop reading it as a company-wide vanity number.
![eNPS and Customer Experience: Why Employee Loyalty Sets the Ceiling on Your CX [2026]](/img/knowledge/enps-and-customer-experience.svg)
- eNPS (employee Net Promoter Score) measures how likely your people are to recommend you as a place to work. It connects to customer experience through the service-profit chain: engaged employees deliver better service, which drives customer loyalty and profit.
- Gallup's meta-analysis of more than 183,000 business units found top-quartile engagement teams outperform bottom-quartile teams by 10% on customer loyalty and 23% on profitability.
- A good eNPS in 2026 sits around +10 to +30 for most organisations, with +30 to +50 strong and +50 and above exceptional. Compare against your industry and company size, not the global average.
- The contrarian part: raising eNPS company-wide does almost nothing for CX on its own. The link runs through the specific people who touch your customers, and through their authority to fix problems, not through generic staff happiness.
- New for 2026: Gallup found managers account for 70% of the variance in team engagement, and that their historical engagement premium over their own reports has disappeared (31% to 22% since 2022). Segmenting eNPS by team is not fine-grained enough if you are not also watching the manager's own score.
Contents8 sections
Relational NPS tells you how your customers feel. eNPS tells you whether the people who serve them can keep it up. In B2B, the second number quietly sets the limit on the first.
What is eNPS, and how does it connect to customer experience?
eNPS, the employee Net Promoter Score, measures how likely your employees are to recommend your company as a place to work. You ask one question on a 0 to 10 scale, split respondents into promoters (9 to 10), passives (7 to 8) and detractors (0 to 6), and subtract the percentage of detractors from the percentage of promoters. The result runs from -100 to +100. It is the same arithmetic as the customer Net Promoter Score, pointed inward.
The connection to customer experience is not a slogan. It is a well-documented chain of cause and effect. The service-profit chain, first laid out by Heskett and colleagues at Harvard Business School, argues that internal service quality drives employee satisfaction, which drives employee retention and productivity, which drives the value customers actually experience, which drives customer loyalty, which drives revenue and profit. Employees are not one input among many. They sit upstream of everything the customer feels, across every one of the six pillars of customer experience.
In B2B this chain is shorter and more brittle than in consumer markets. When a bank serves millions of customers, one disengaged teller barely moves the aggregate. When your business runs on 60 accounts and each one is handled by a named account manager, a support engineer and a customer success lead, those three people are the relationship. If they are checked out, no dashboard, playbook or QBR template will hide it from the customer for long.
Why does employee engagement set a ceiling on B2B CX?
Because the customer cannot have a better experience than the person delivering it is capable of giving on a bad week.
Gallup's Q12 meta-analysis, which pooled 736 studies across 347 organisations and more than 183,000 business units, found that teams in the top quartile of employee engagement outperformed bottom-quartile teams by 10% on customer loyalty and ratings and by 23% on profitability. That is not a study of one company having a good year. It is one of the most replicated findings in management research.
Forrester's 2025 Total Experience work points the same direction from the other end. When employee experience, customer experience and brand experience reinforce one another, companies build trust and loyalty. When they pull apart, growth breaks. Notably, Forrester found that among US brands with employee experience data, only 25% saw a positive employee-experience effect on their total experience, while 37% saw a negative one. For most companies, the people layer is dragging the customer layer down, not lifting it up.
The mechanism is mundane. Engaged employees notice problems earlier, take ownership without being told, and push back internally to get a customer unstuck. That is the difference between a team that just delivers great customer service and one that goes through the motions. Disengaged people do the minimum, escalate nothing, and let a solvable irritation harden into a churn decision. In a market where reducing churn is the whole game, that difference compounds account by account.
What is a good eNPS in 2026?
Benchmarks help, but only if you read them with the same discipline you apply to NPS benchmarks. Here is the rough map for 2026.
| eNPS range | How to read it | Caveat |
|---|---|---|
| Below 0 | More detractors than promoters. A retention and service risk, not just an HR problem. | A single reorganisation or bad quarter can push a healthy team here temporarily. |
| 0 to +30 | Healthy for most organisations. The median across large benchmark sets sits around +12 to +17. | The median drops as companies grow and varies by up to ~50 points between countries. |
| +30 to +50 | Strong. Typical of well-run tech and knowledge firms. | High scores can hide a burned-out sub-team. Segment before you celebrate. |
| Above +50 | Exceptional, or a sign nobody feels safe answering honestly. | Check response rate and anonymity before trusting it. |
Two rules matter more than the ranges. First, compare against your own industry and company size, because manufacturing and SaaS live in different worlds and eNPS trends down as headcount grows. Second, watch the trend line for your customer-facing teams specifically. A stable +20 that just dropped to +5 in your support organisation is a louder signal than an absolute number ever is.
The mistake most companies make: reading eNPS as one company number
This is the contrarian point, and it is the one that costs the most.
A company-wide eNPS is a blended average across finance, engineering, legal, sales and support. It tells you something about your employer brand. It tells you almost nothing about customer experience, because the customer never meets your finance team. A cheerful back office can paper over a support organisation that is quietly falling apart.
Consider a fictional example. Nordika A/S runs a company-wide eNPS of +34 and reports it proudly to the board. Segment it by function and the picture changes: engineering sits at +55, but the customer success team that manages the top 20 accounts sits at -8, worn down by understaffing and a broken handover from sales. The blended number looks strong. The number that predicts next year's churn is negative, and it is invisible on the headline slide.
The fix is not more surveying. It is segmentation. Break eNPS out by customer-facing role and, where you can, by the teams that serve your most valuable accounts. This is the same logic behind key driver analysis on the customer side: the aggregate hides the thing you need to act on. If you only look at one eNPS number, look at the one for the people who answer your customers' emails.
Even Team-Level Segmentation Is Not Fine-Grained Enough: The Manager Is the Real Lever
Splitting eNPS by function and by customer-facing team fixes the biggest blind spot. It does not fix the next one down.
Gallup's long-running manager research puts a hard number on something most CX leaders sense but rarely measure: managers account for roughly 70% of the variance in team-level engagement. Know nothing about an employee except who they report to, and you can predict a large share of how engaged that person is. A team's eNPS is not really the average opinion of five or six people. It is mostly one person's shadow, cast over everyone below them.
That would be a stable, manageable fact if manager quality held steady. It has not. Gallup's State of the Global Workplace 2026 report found manager engagement dropped nine points between 2022 and 2025, from 31% to 22%, with five of those points lost in a single year, 2024 to 2025. Individual-contributor engagement barely moved over the same period. Managers used to run an "engagement premium", meaningfully more engaged than the people they led. That premium is gone. For the first time in Gallup's tracking, a manager is, on average, no more engaged than their own team.
Run the two findings together and the implication for B2B account teams is direct. If your customer success lead or senior account manager has quietly checked out, under margin pressure, a bad reorganisation, or simple burnout, that disengagement is not diluted by the team average. It is the dominant input to it, and per Gallup's numbers, the base rate of managers being in that position just got measurably worse across the board, not worse at one unlucky company.
The fix is not another survey layer. It is a distinct read, not a blended one. Tag the manager's own eNPS response separately from their team's aggregate, and track it as its own trend line, the same way you would track a customer health score as a leading indicator rather than a lagging one. In account-based CX programmes especially, where a handful of named people carry your highest-value accounts, a dropping manager score on that specific team deserves the same urgency as a dropping NPS score on the account itself, because by the time the account's score moves, the manager's engagement has usually already been falling for a quarter or two.
- Manager engagement-9%202231%202522%
What actually raises both eNPS and CX?
Not perks. Free coffee and a foosball table move eNPS by a rounding error and CX not at all. The conditions that raise both are less photogenic.
The first is authority to fix problems. An account manager who can issue a credit, escalate a bug straight to engineering, or bend a process for a key customer is both more engaged and more capable of rescuing an experience. One who has to route every exception through three approvals is neither. Give frontline people the mandate to act, and you improve the employee's day and the customer's outcome in the same move.
The second is low internal friction. Every clunky internal tool, every duplicated data entry, every meeting that should have been a decision taxes the employee and slows the customer. This is the internal-service-quality link in the service-profit chain, and it is where most CX programmes never look.
The third is closing the loop internally, the way the best programmes close the loop with customers. When an employee flags a recurring problem and watches it get fixed, engagement rises and the root cause of a CX complaint disappears at once. When their feedback vanishes into a survey nobody reads, both scores rot.
Here is the distinction that matters:
| Lever | Effect on eNPS | Effect on CX |
|---|---|---|
| Perks and events | Small, short-lived | None |
| Higher pay alone | Moderate, temporary | None directly |
| Authority to resolve customer issues | Strong and durable | Strong and direct |
| Removing internal friction | Strong | Strong, often invisible until removed |
| Acting on employee feedback | Strong | Strong via fewer recurring complaints |
How do you run eNPS so it actually improves customer experience?
Run it like a CX programme, not an annual HR ritual. Measure at a cadence that lets you act, quarterly for customer-facing teams rather than once a year. Keep it anonymous enough that people answer honestly, but segmented enough that you can tell the support team from the finance team.
Then connect the two datasets. If your customer NPS and your team eNPS live in different systems owned by different departments, nobody will ever see the correlation that matters. Put them side by side. When an account's customer experience score slips, look at the eNPS of the team serving it before you blame the customer or the product. And close the loop with employees on a visible cadence, because an eNPS survey that leads to no change teaches people that feedback is theatre, and they answer accordingly next time.
Where SurveyGauge fits
Most companies measure customer feedback in one tool and employee feedback in another, if they measure eNPS at all. The two numbers never meet, so the link between them stays invisible until a valued account leaves and everyone is surprised.
SurveyGauge runs customer NPS and eNPS in one place, so you can segment employee engagement by customer-facing team and read it next to the CX scores for the accounts those teams serve. Because we run the programme with you rather than handing you a dashboard, the awkward finding, that your best account team is the one running on empty, actually reaches the people who can fix it. Partner, not tool.
See your customer and employee feedback in one place, and finally read the two numbers that decide whether your CX holds. Book a demo or see pricing.
Frequently Asked Questions
Ready to know what your customers actually think?
SurveyGauge helps Nordic B2B companies move from gut feeling to data-driven CX decisions.
SurveyGauge Team
Customer Experience Experts
SurveyGauge-teamet hjælper virksomheder med at måle og forbedre kundetilfredshed via professionelle surveys, analyser og rådgivning.
You might also be interested in
View all articles![How to Deliver Great Customer Service: Principles and Practice for B2B [2026]](/img/knowledge/customer-service.svg)
How to Deliver Great Customer Service: Principles and Practice for B2B [2026]
How do you deliver great customer service in B2B? The core principles, from First Contact Resolution to low effort done right, plus where AI self-service helps or erodes trust in 2026.
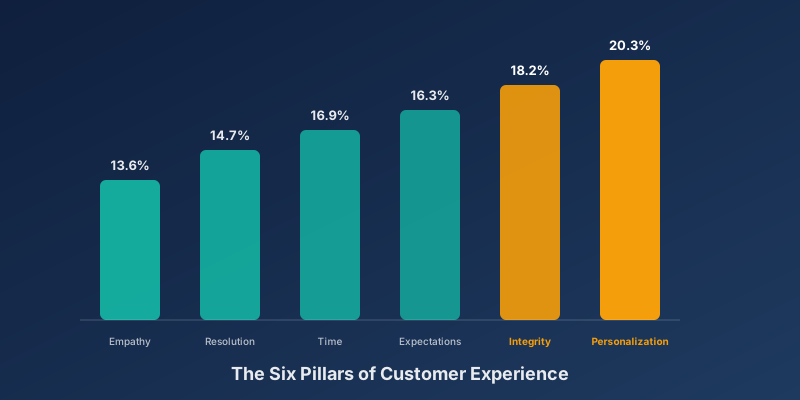
The 6 Pillars of Customer Experience: What Drives Loyalty and NPS
KPMG's Customer Experience Excellence report identifies six universal drivers behind NPS and loyalty, weighted from 80,594 interviews. Integrity and Personalization combined drive 39% of loyalty, and B2B buying committees make Personalization structurally harder than in B2C.
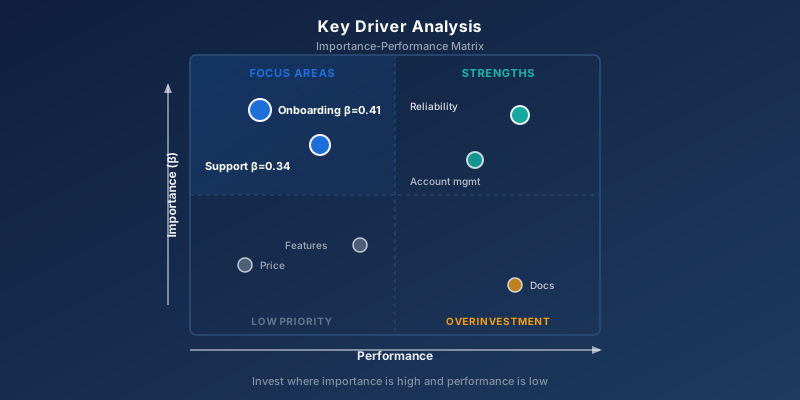
Key Driver Analysis: Find Out What Actually Moves Your NPS
NPS tells you THAT something is wrong. Key driver analysis tells you WHAT. Here is the method that turns a score into a prioritised action plan.
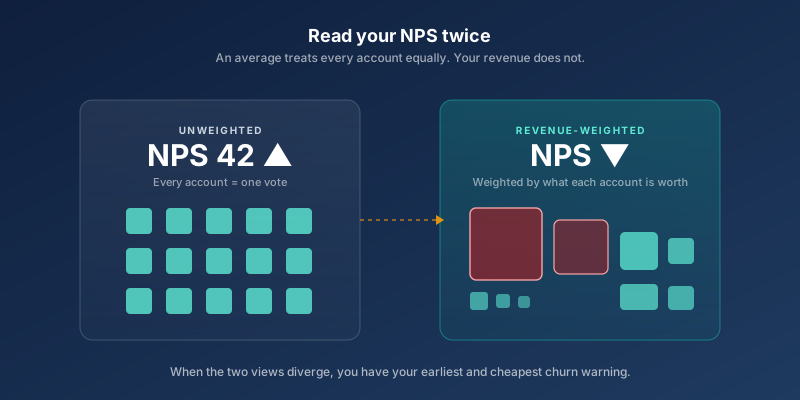
Account-Based CX: Run Your Feedback Programme on the Accounts That Pay the Bills
In most B2B companies a small share of accounts carries most of the revenue, yet every account gets the same survey and the same weight in the score. Account-based CX fixes that mismatch: weight feedback by account value, survey the whole buying group, and tier your follow-up.
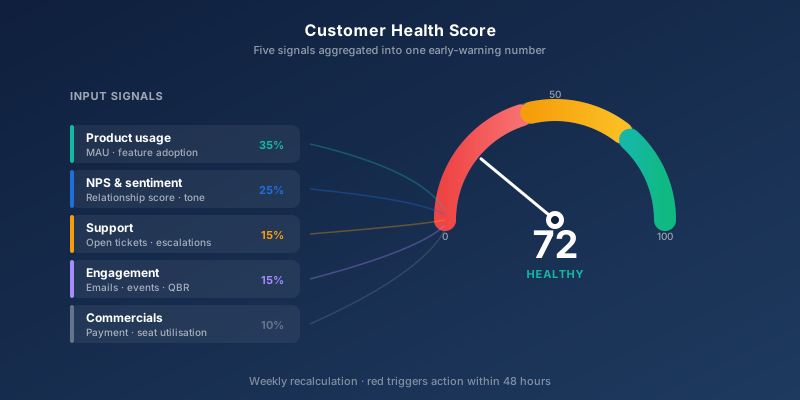
Customer Health Score: Build an Early Warning System for Churn
Customers decide to churn 60-90 days before the cancellation hits your CRM. A Customer Health Score surfaces the signal before you lose them. Here is how to build one that actually works.