
Customer Satisfaction and Revenue: How to Build the Business Case [2026]
Your CFO does not care about NPS. They care about revenue. Here is how to translate customer satisfaction into retention, expansion and profit, and why fixing your Detractors is worth more than creating new Promoters.
![Customer Satisfaction and Revenue: How to Build the Business Case [2026]](/img/knowledge/revenue.svg)
- A 5% increase in retention boosts profit by 25-95% (Bain & Company). That single number still makes the business case on its own.
- The real asymmetry: Bain's Dell research found a Detractor costs the company $57 in value while a Promoter generates $328. Fixing your worst-scoring accounts carries a bigger multiplier than creating new advocates.
- A 10-point NPS increase correlates with a 3.2% increase in upsell revenue (CustomerGauge), and Forrester's 2026 Total Experience research shows the effect compounds further, up to 3.5x revenue growth, when customer, brand and employee experience move together.
- In fact, churn does not just cost lost revenue. It costs the entire remaining Customer Lifetime Value plus the acquisition cost of the replacement. Most companies underestimate this by 3-5x.
- The fastest way to prove this inside your own organisation is still a 90-day close-the-loop pilot: contact every Detractor, measure saved accounts, calculate retained revenue.
Contents7 sections
The CX team's problem with the C-suite
Customer experience professionals know that satisfaction drives retention, expansion, and referrals. However, the problem is that most of them cannot prove it in financial terms. They present NPS trends and customer quotes. Meanwhile, the CFO wants to see revenue impact and payback periods.
This article is about bridging that gap. Not with theory, but with the specific calculations, research, and frameworks you need to build a business case that finance takes seriously.
The research that matters
Bain & Company: the retention multiplier
A 5% increase in customer retention boosts profit by 25-95%. This is the most cited number in CX, and it holds up. The mechanism is straightforward: existing customers cost less to serve and buy more over time.
Reichheld and NPS leaders
Fred Reichheld's research found that NPS leaders in 11 of 14 industries grew more than twice as fast as their industry average. Admittedly, correlation is strong, causality is debated, but the pattern is consistent.
PwC: the willingness-to-pay premium
PwC's Future of Customer Experience survey found that 86% of buyers are willing to pay more for a good experience. For premium brands, the price premium is typically 13-18%. In B2B, this translates to reduced price sensitivity during renewals.
Temkin Group: Promoter economics
Promoters (NPS 9-10) versus Detractors (0-6):
- Spend 3-4x more
- Recommend to 5-10 contacts
- Have 4-7x higher Customer Lifetime Value
Those are not marginal differences. Indeed, they are the economics that justify every CX investment.
CustomerGauge: the compounding upsell effect
A 10-point increase in NPS correlates with a 3.2% increase in upsell revenue, according to CustomerGauge's B2B benchmark research. It sounds modest until you apply it to your own base: for a company with $50 million in annual recurring revenue, a 10-point NPS gain is worth roughly $1.6 million in additional upsell alone, before counting retention or referral effects. Benchmark your own starting point first; our NPS benchmarks by industry show what a realistic 10-point gain actually requires depending on your sector.
Forrester: Total Experience compounds the effect further
Forrester's 2026 Total Experience research found that companies improving customer experience, brand experience and employee experience together can see up to 3.5x revenue growth, with the multiplier varying by sector: 3.8x for retailers, 2.6x for automotive companies. The B2B takeaway is specific: a business case that includes employee engagement data is a stronger case than one built on customer data alone, because in B2B the account manager or support engineer often is the relationship.
Why fixing Detractors beats making more Promoters
This is the sharpest number in the entire research base, and most CX teams build their business case backwards because of it.
Bain's widely cited Dell study found that a Detractor costs the company $57 in value, while a Promoter generates $328. That gap means the financial damage from an unhappy account is not a rounding error next to the value a happy one creates, and a business case built only on "let's create more Promoters" leaves the bigger lever untouched. It is also a reminder that satisfaction alone never defended an account: what keeps it is loyalty, which is a different thing and built differently.
The Dell numbers make the case concrete. Dell had 15% Detractors, representing $68 million in lost revenue. According to Bain's analysis, converting just 2-8% of those Detractors into Promoters would have added $167 million in annual revenue, more than double the amount originally lost. Detractors also account for more than 80% of negative word of mouth, so the damage compounds well beyond the account itself.
The practical implication for your business case: lead with the cost of your worst-scoring accounts, not the upside of your best ones. It is a harder conversation to open with, but it is the one with the bigger number attached. Our Detractor recovery playbook sets out exactly how to turn this asymmetry into saved revenue, account by account.
Three calculations for your business case
1. The true cost of churn
Most companies calculate churn cost as lost revenue for the period. As a result, that understates the damage by 3-5x.
Real churn cost = Lost CLV + acquisition cost of replacement
Example:
- 1,000 customers churn per year
- Average CLV: $50,000
- Lost CLV: $50 million
- Replacement cost (typically 1-3x CLV for acquisition + onboarding): $50-150 million
- Total annual churn cost: $100-200 million
That number gets attention in every boardroom.
2. NPS segment revenue analysis
Segment your customer base by NPS score and compare average revenue per segment:
| Segment | Score | Count | Avg. Revenue |
|---|---|---|---|
| Promoters | 9-10 | 500 | $120,000 |
| Passives | 7-8 | 300 | $75,000 |
| Detractors | 0-6 | 200 | $40,000 |
Converting 50 Detractors to Passives generates 50 x ($75,000 - $40,000) = $1.75 million in additional revenue, while reducing churn risk on those accounts. If you weight this by actual account value rather than a flat average, the number usually gets larger, not smaller; see account-based CX for how to build that weighting into the survey programme itself.
3. Promoter referral value
If each Promoter generates one referral per year with a CLV of $50,000, and you have 500 Promoters, that is $25 million per year in referral-driven revenue. Even at a conservative 20% referral rate, it is $5 million.
Furthermore, referral revenue is the most profitable revenue you have: zero acquisition cost, shorter sales cycles, and higher retention.
Building the case for leadership
A business case that gets funded has six elements:
What we see in practice
Among the companies we work with, the business case fails for one of three reasons:
Too abstract. "Improving customer satisfaction will reduce churn" convinces nobody. Specifically, "Our Detractors churn at 34% per year versus 6% for Promoters, representing $2.4 million in at-risk revenue" gets budget approved.
No baseline. You cannot demonstrate improvement without a starting point. Before asking for investment, establish your current NPS by segment, churn rate by NPS category, and CLV by tier. Key driver analysis is the fastest way to find out which specific driver to fix first, rather than guessing.
No quick wins. Leadership wants to see evidence before committing to a multi-year programme. A 90-day close-the-loop pilot provides that evidence. Match the size of the business case to where you actually sit on the CX maturity model: a level 2 programme wins budget by proving one loop closes, not by promising a transformation.
The 90-day pilot that proves ROI
The fastest path from theory to proof:
- Run an NPS survey. Identify 200-300 Detractors.
- Implement a close-the-loop process: contact every Detractor within 48 hours.
- After 90 days, compare churn rate for contacted Detractors versus a control group of non-contacted Detractors (or historical data).
- Calculate saved accounts x CLV = programme ROI.
This gives you a concrete number for the leadership presentation. In our experience, the ROI of a well-executed pilot typically exceeds 5:1, which is consequently more than enough to justify scaling the programme.
For the churn reduction strategies that follow the business case: How to Reduce Churn.
If the real barrier is that nobody internally has the time to operate the measurement, the cadence and the follow-up, there is a delivery model built for exactly that: Retention as a Service.
Frequently Asked Questions
Ready to know what your customers actually think?
SurveyGauge helps Nordic B2B companies move from gut feeling to data-driven CX decisions.
SurveyGauge Team
Customer Experience Experts
SurveyGauge-teamet hjælper virksomheder med at måle og forbedre kundetilfredshed via professionelle surveys, analyser og rådgivning.
You might also be interested in
View all articles![What Is NPS? The Complete Guide to Net Promoter Score [2026]](/img/knowledge/nps.svg)
What Is NPS? The Complete Guide to Net Promoter Score [2026]
NPS is the most widely used loyalty metric in the world, and also the most frequently misused. Indeed, the score means nothing without follow-up. Here is how to use it properly.

Detractor Recovery: The Playbook for Saving Unhappy B2B Accounts
A detractor is not a lost account. It is the most recoverable revenue you have, but only if you treat recovery as a process with deadlines and owners, not a goodwill gesture. Here is the playbook.
Key Driver Analysis: Find Out What Actually Moves Your NPS
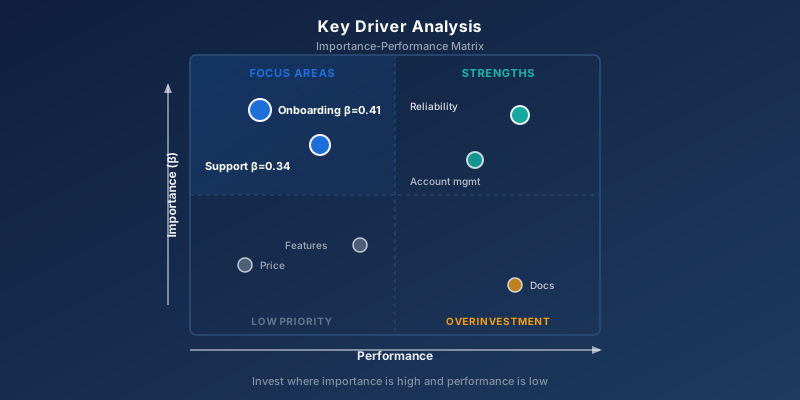
NPS tells you THAT something is wrong. Key driver analysis tells you WHAT. Here is the method that turns a score into a prioritised action plan.
![CX Governance: Who Owns Customer Experience in a B2B Organization? [2026]](/img/knowledge/cx-governance.svg)
CX Governance: Who Owns Customer Experience in a B2B Organization? [2026]
Most B2B companies never decide who owns customer experience, so it defaults to whoever has the loudest voice when a renewal is at risk. Here is what a governance model that actually holds looks like, including who owns what an AI agent says to your customers.
![How to Build Customer Loyalty: Strategies That Drive Loyal B2B Customers [2026]](/img/knowledge/customer-loyalty.svg)
How to Build Customer Loyalty: Strategies That Drive Loyal B2B Customers [2026]
How do you build customer loyalty in B2B? Why satisfied customers still leave, the real drivers, and the concrete moves that turn accounts into advocates.

How to Reduce Churn: 7 Strategies That Work
Churn is the most expensive problem most B2B companies underestimate. Here are seven strategies that work, from early warning systems to win-back campaigns, with the numbers behind each.