
What Is CSAT? Guide to Customer Satisfaction Score
CSAT is the most direct satisfaction metric you can use, but it is also the most abused. Therefore, here is how to deploy it properly, when to trust it, and when it misleads.
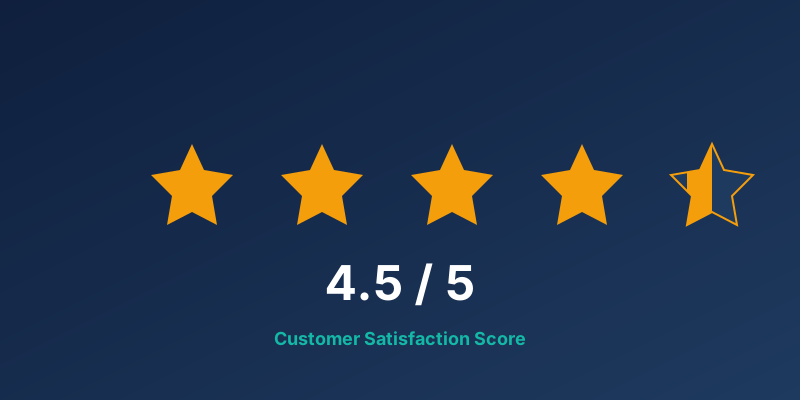
- CSAT measures satisfaction with a specific experience, not with your company overall. That distinction is critical to using it properly.
- The score is the percentage of customers who rated 4 or 5 on a 5-point scale. Simple to calculate, easy to game, important to guard against inflation.
- CSAT is strongest at touchpoint level: support, onboarding, delivery. It is weak at predicting loyalty or churn.
- A CSAT of 80% in financial services and 80% in e-commerce are different achievements. Always benchmark within your industry.
Contents11 sections
CSAT is the most intuitive metric in customer experience. You ask a customer how satisfied they were. They tell you. No segmentation into promoters and detractors, no effort scales. Just a direct question about a specific experience.
That simplicity is its greatest strength and its biggest trap. Specifically, because CSAT is easy to collect, companies collect it everywhere, act on it nowhere, and end up with dashboards full of numbers that drive zero improvement.
However, used properly, CSAT is one of the sharpest diagnostic tools you have for fixing specific touchpoints. Used poorly, it becomes a vanity number that masks real problems.
The CSAT Question
The standard CSAT question is:
"How satisfied were you with [experience/product/service]?"
Three scale formats are common:
- 5-point scale: Very dissatisfied to Very satisfied (the industry standard)
- 3-point scale: Dissatisfied / Neutral / Satisfied (faster, less granular)
- 7-point scale: More nuance, but often confuses respondents
Stick with the 5-point Likert scale unless you have a specific reason not to. It is the best balance between detail and response rate.
Calculating CSAT
CSAT = (Number of satisfied responses / Total responses) × 100
"Satisfied" means scores of 4 and 5 on a 5-point scale. Scores of 1-3 are excluded from the numerator.
Example
You survey 300 customers after support interactions. 150 respond:
| Score | Count |
|---|---|
| 5 - Very satisfied | 75 |
| 4 - Satisfied | 45 |
| 3 - Neutral | 20 |
| 2 - Dissatisfied | 7 |
| 1 - Very dissatisfied | 3 |
Satisfied (4+5): 120
CSAT = (120 / 150) × 100 = 80%
An 80% CSAT is solid for most industries, but context matters. For example, 80% in telecoms would be exceptional. 80% for premium SaaS support would be a concern.
Where CSAT Works (and Where It Falls Short)
CSAT is a touchpoint metric. It answers: "Was this specific experience acceptable?" It does not answer: "Will this customer stay?" or "Is this customer loyal?"
Strong use cases
Customer support. The most common CSAT deployment. A post-resolution CSAT score tells you directly whether the support experience met expectations. Break it down by agent, channel, and issue type for actionable insight.
Onboarding. CSAT at onboarding milestones (day 7, day 30, day 90) reveals whether new customers feel equipped to use your product. Low onboarding CSAT is an early warning for first-year churn.
Product delivery. E-commerce and logistics companies use CSAT to measure the delivery experience separately from the product itself.
Feature releases. SaaS teams use in-app CSAT to gauge reception of new features while usage data is still ambiguous.
Events and webinars. Quick CSAT after a session captures attendee perception while the experience is fresh.
Where CSAT misleads
CSAT does not predict loyalty. A customer can score 4/5 today and churn next quarter because a competitor offered a better price. Furthermore, it does not capture effort, a customer can be "satisfied" with the outcome of a support interaction that took three transfers and two days. For those dimensions, you need CES and NPS.
CSAT in B2B: Measuring a Project, Not a Ticket
CustomerGauge's research puts CSAT as the second most common B2B experience metric: 33% of NPS users add it specifically to cover touchpoints where NPS is too blunt an instrument (CustomerGauge, 2026). But most CSAT guidance, including the benchmark table below, is written for transactional B2C moments: a support ticket, a delivery, a single purchase. B2B project work rarely fits that model.
A mid-size ERP or software implementation runs for months, involves a buying committee instead of a single respondent, and delivers value in milestones, kickoff, go-live, first quarter of use, rather than one-off tickets. IT-Effect, a Danish IT services company in the Microsoft Dynamics ERP world, shows the project-first principle in practice: instead of one blended company-wide score, satisfaction is measured after every project and support interaction, tied to the responsible project manager, and read project by project. A dip right after kickoff means something different from a dip after go-live. Blending the two into a single average would hide exactly the signal a project manager needs to act on.
Three adjustments make CSAT work for project-based B2B:
- Survey milestones, not every interaction. Tie the CSAT question to project phases (scoping, kickoff, go-live, 90 days post-launch) rather than firing it after each touchpoint. With a handful of stakeholders per account, fewer and better-timed surveys beat frequent, generic ones. The 90-day milestone doubles as an early churn signal if you time it alongside a B2B onboarding survey.
- Weight by project or account value. A CSAT built equally from a 50,000-kroner project and a 2-million-kroner implementation misrepresents your portfolio. This is the same logic behind account-based CX.
- Feed it into a health score, not just a dashboard. A single low CSAT at go-live is a data point. A low CSAT combined with slipping usage and a support ticket spike is a warning. That is the core idea behind a customer health score.
For turning any satisfaction data, CSAT included, into a ranked list of what to fix first, see key driver analysis.
CSAT vs. NPS vs. CES
| Metric | Measures | Timing | Scale |
|---|---|---|---|
| CSAT | Specific satisfaction | Transactional | 1-5 or 1-3 |
| NPS | Loyalty and recommendation | Relational/periodic | 0-10 |
| CES | Effort and friction | Transactional | 1-7 |
Indeed, the three are complementary. None of them is complete on its own. For the full breakdown: NPS vs. CSAT vs. CES.
Response Rates by Channel
| Channel | Typical Response Rate |
|---|---|
| 10-30% | |
| In-app/in-product | 30-50% |
| SMS | 25-40% |
| Live chat popup | 40-60% |
| IVR (phone) | 5-15% |
The biggest lever is timing. Surveys sent within an hour of the experience consistently outperform those sent the next day. Keep it to one or two questions, use a recognisable sender, and test send times (B2B mornings on weekdays tend to work best).
For a deeper look at improving participation: How to Improve Your Survey Response Rate.
Industry Benchmarks
| Industry | Average CSAT |
|---|---|
| E-commerce | 78-82% |
| SaaS / Technology | 78-84% |
| Finance and Banking | 75-80% |
| Telecommunications | 62-70% |
| Healthcare | 76-82% |
| Hospitality and Travel | 80-85% |
| Public Sector | 65-72% |
These are indicative. Benchmark against your sub-industry and direct competitors, not generic averages.
2026 update. Retently's 2026 CSAT benchmark, covering thousands of companies across 16-plus sectors, puts Consulting and Digital Marketing Agency jointly at the top with a score of 83. Digital Marketing Agency made the biggest jump, up from 72 the year before. Financial Services follows close behind at 81. Healthcare tells the opposite story: it fell from 81 to 57, the sharpest single-year drop in this year's data. Communication & Media remains the weakest sector at 26 (Retently, 2026). Most industries now sit somewhere in the 65-80 range, so a CSAT below 65 is a bigger gap than a quiet quarterly dashboard tends to suggest.
Read that table as a compass, not a scorecard, though. Unlike NPS, CSAT has no standardized cross-industry benchmark: the scale (1-5, 1-7, 1-10, thumbs, stars), the calculation method, and what counts as a top-box score all vary from company to company and from benchmark provider to benchmark provider. CustomerGauge says it plainly in its own research: NPS is benchmarkable across industries, CSAT is not (CustomerGauge, 2026). Track your CSAT against your own history and your closest competitors' publicly reported numbers. A cross-industry average built on a scale you cannot verify tells you less than it appears to.
What We See in Practice
Among the companies we work with, three CSAT patterns come up repeatedly:
Aggregate scores hide everything. A company-wide CSAT of 82% tells leadership things are fine. Yet break it down by agent, product line, and customer segment, and you find one team at 92% and another at 64%. The aggregate obscured a serious problem.
Score inflation is rampant. Support agents who ask customers to "rate them a 5" or who cherry-pick which interactions get surveyed produce CSAT data that is useless. If your CSAT programme allows agents to influence who gets surveyed, you are measuring their ability to game the system, not customer satisfaction.
The open-ended question is where the value lives. The number tells you something is wrong. The text response tells you what. Consequently, companies that skip text analysis are leaving the most actionable part of CSAT on the table. An AI agent that reads and triages those comments as they arrive turns this from a quarterly research exercise into an operational one. See how that works in AI agents for customer satisfaction.
Common Mistakes
Not segmenting. An overall CSAT hides the signal. Segment by agent, team, product, customer tenure, and channel. That is where you find the problems worth fixing.
Measuring without ownership. If nobody owns the CSAT score for a given touchpoint, nobody improves it. Assign owners before you launch the survey.
Changing the scale. Switching from a 5-point to a 3-point scale mid-programme destroys your trend data. Pick a scale and commit to it.
Surveying without acting. Customers who give feedback and see nothing change become more dissatisfied than customers who were never asked. If you are not going to close the loop, do not open it.
Best Practices
- Trigger surveys automatically and immediately. Do not rely on manual survey distribution. Integrate with your support, CRM, or e-commerce platform so surveys fire automatically after the interaction. The closer to the experience, the better the data.
- One metric question plus one open-ended question. That is the ideal transactional CSAT survey. Anything longer reduces response rates without proportionally increasing insight. The open-ended follow-up ("What is the main reason for your score?") is not optional.
- Segment ruthlessly. Break CSAT down by every dimension that matters to your business: agent, team, channel, product line, customer type, geography. The insight lives in the segments, not the average.
- Act on low scores within 48 hours. Customers who score 1 or 2 should trigger an automatic alert to the team owner. Proactive follow-up on dissatisfied customers prevents churn and sometimes recovers the relationship entirely. See our guide to closing the loop.
- Guard against gaming. Survey all interactions, not a subset chosen by agents. Randomise if volume is too high. And never tie individual CSAT scores to bonuses without safeguards, it creates perverse incentives.
CSAT in the CX Stack
CSAT works best as part of a layered measurement approach:
- NPS for overall relationship health and loyalty trends
- CSAT for diagnosing specific touchpoint quality
- CES for identifying friction in processes
No single metric gives you the full picture. CSAT tells you whether a specific experience was acceptable. NPS tells you whether the customer will stay. Additionally, CES tells you whether the process was unnecessarily hard. Together, they cover the strategic, tactical, and operational layers of customer experience.
Pick two or three touchpoints that matter most to your business. Implement CSAT there. Analyse the segments. Act on the low scores. That is how CSAT creates value, not as a dashboard number, but as a trigger for improvement.
Frequently Asked Questions
Ready to know what your customers actually think?
SurveyGauge helps Nordic B2B companies move from gut feeling to data-driven CX decisions.
SurveyGauge Team
Customer Experience Experts
SurveyGauge-teamet hjælper virksomheder med at måle og forbedre kundetilfredshed via professionelle surveys, analyser og rådgivning.
You might also be interested in
View all articles![What Is NPS? The Complete Guide to Net Promoter Score [2026]](/img/knowledge/nps.svg)
What Is NPS? The Complete Guide to Net Promoter Score [2026]
NPS is the most widely used loyalty metric in the world, and also the most frequently misused. Indeed, the score means nothing without follow-up. Here is how to use it properly.
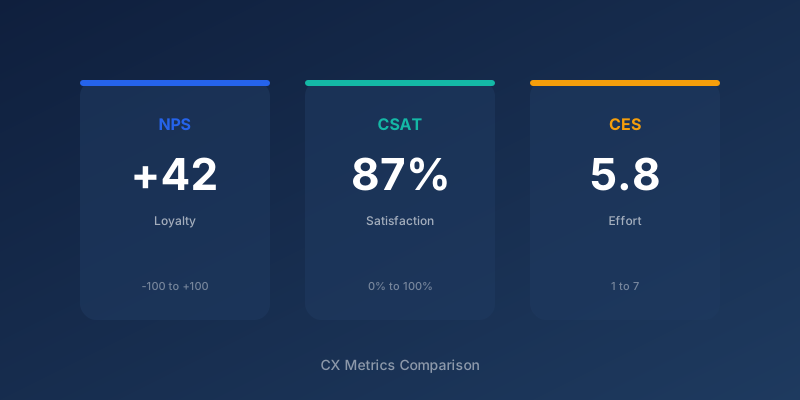
NPS vs. CSAT vs. CES: Which Metric Should You Choose?
NPS, CSAT, and CES measure different things, and the real question in 2026 is not which one wins. It is when to layer a second metric on top of NPS, and when adding one just adds noise.
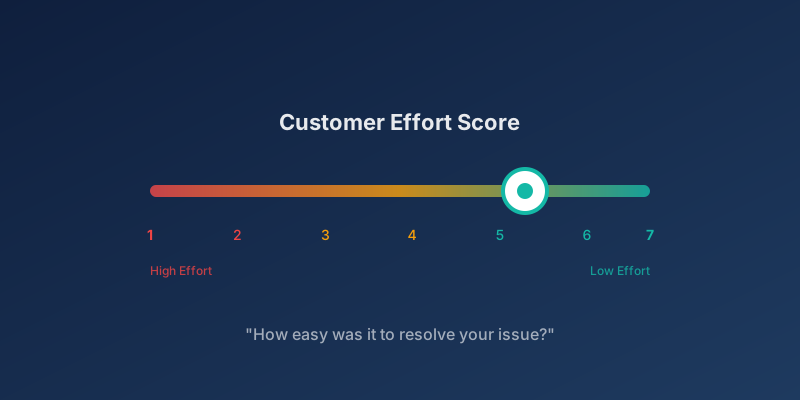
What Is CES? Customer Effort Score Explained
Customer Effort Score (CES) measures how hard it was for a customer to get something done. It predicts churn better than satisfaction does.
![How to Deliver Great Customer Service: Principles and Practice for B2B [2026]](/img/knowledge/customer-service.svg)
How to Deliver Great Customer Service: Principles and Practice for B2B [2026]
How do you deliver great customer service in B2B? The core principles, from First Contact Resolution to low effort done right, plus where AI self-service helps or erodes trust in 2026.