TL;DR
- There is no single good B2B response rate. CustomerGauge reports an average of 12.4% (range 4.5% to 39.3%), and in its 2026 benchmark 40% of programmes sit at 10% or below.
- The percentage is the wrong target. Manage coverage: the share of your accounts, and of your revenue, that you have actually heard from in the last 12 months.
- The biggest gains are unglamorous: a named sender, a survey sent while the memory is fresh, two minutes or less, one reminder and a visible reply to the last round of answers.
- Counterintuitive: a higher response rate from the same satisfied contacts makes your picture worse, not better. Silence from a large account is data.
Contents11 sections
What is a good survey response rate in B2B?
There is no single good survey response rate in B2B, because the right number depends on who you ask, why, and how many accounts hide behind each response. The most quoted figure is CustomerGauge's average of 12.4% for B2B NPS surveys, with programmes ranging from 4.5% to 39.3%. CustomerGauge also tells B2B brands to aim for 60% or above, but that is a recommended target and a claim about its own clients, not a measured top group.
The more useful finding comes from CustomerGauge's NPS Benchmark Report: Decade Edition (340 B2B programmes, 6 May to 13 July 2026): 40% of programmes get a response rate of 10% or less. If you sit at 15%, you are not behind. If you sit at 40% but your ten largest accounts never answer, you are not ahead either.
This guide covers the levers that move the percentage, and they are worth pulling. But it starts with the argument most response-rate advice skips: the percentage is not the thing you need to fix. If you are new to the metric behind the survey, start with what NPS is and the getting started guide.
Why the benchmark you quote flatters you
Three things make a response-rate benchmark look kinder than your real market.
First, the 12.4% average comes from CustomerGauge's own report, The State of B2B Account Experience, and the page does not disclose sample size, period or how programmes were selected. It is a vendor's view of its own client base. Second, published benchmarks tend to come from programmes that are organised enough to measure and share their numbers. Third, even the better-documented Decade Edition reports two different medians on two different bases: 15% self-reported and 19% measured on the platform. Do not mix them in one sentence, and note the report's own warning that self-reported figures skew optimistic and true market averages are likely worse.
We also removed a "20-30% is the B2B average" claim that earlier versions of this article carried, because we could not trace it to a named, dated source.
Here is the distribution that we can name:
| Response rate band | Share of programmes |
|---|---|
| Under 5% | 14% |
| 5-10% | 26% |
| 11-20% | 26% |
| 21-35% | 18% |
| 36-50% | 9% |
| Over 50% | 8% |
Source: CustomerGauge, NPS Benchmark Report: Decade Edition, 340 B2B programmes, 6 May to 13 July 2026. Shares add up to 101% because of rounding.
One more number from the same report: 49% of programmes with a formal response-rate target achieve more than 20% response, against 30% of programmes with no target. That is a correlation. It does not prove that a target causes the rate, but it is a cheap thing to try. The question is which target to set.
- Under 5%14%
- 5-10%26%
- 11-20%26%
- 21-35%18%
- 36-50%9%
- Over 50%8%
The number to manage: coverage, not response rate
A response rate counts answers per invitation. It says nothing about who is missing. Two numbers say more:
- Account coverage: accounts with at least one response in the last 12 months, divided by active accounts.
- Revenue coverage: the revenue of those accounts, divided by total revenue.
CustomerGauge's Decade Edition found that 60% of programmes do not know their revenue coverage, and it argues that programmes at 10% response or below have no clue about 90% of their accounts. Read that as the report's own framing, but the direction is hard to argue with.
Here is an illustration, built by SurveyGauge with fictional numbers. Nordika A/S has 120 active accounts and invites 400 contacts. Sixty respond, so the response rate is 15%, right at the Decade Edition median. But those 60 answers come from 31 accounts that together carry 38% of revenue, and none of the 12 largest accounts answered. The report on the dashboard says 15%. The truth is 26% account coverage (31 of 120), 38% revenue coverage and zero coverage of the accounts that matter most.
Now the counterintuitive part. If Nordika pushes the rate from 15% to 25% by chasing the same cheerful contacts inside the same 31 accounts, the number improves and the picture gets worse, because the blind spots stay where they were and the score becomes more confident about the wrong people.
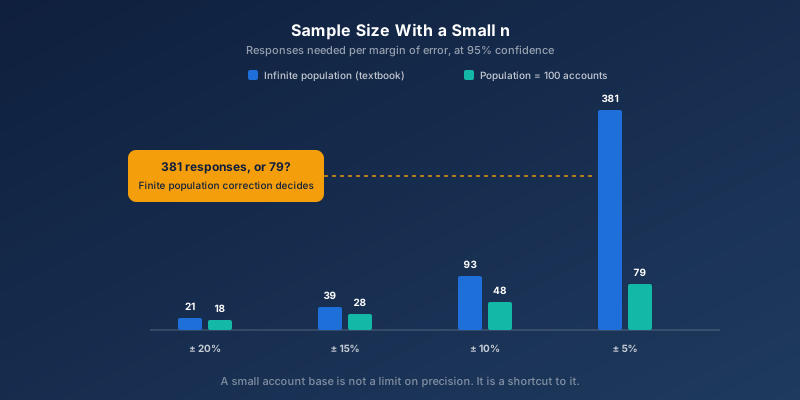
So set the target on coverage, and run the contact plan per account: more than one contact per account, with the survey owner knowing which accounts have zero answers. This is the logic of account-based CX, and deciding who to ask in each account is part of how to measure customer satisfaction. If you want to know how many answers you need for statistical precision, that is a separate question, answered in B2B survey sampling with a small n.
Lever 1: Who sends it matters more than what it says
An invitation from a person the customer knows beats one from a no-reply address. CustomerGauge's own advice is a short subject line such as "How did we do?", a face and a personal signature, and no spam-trigger phrases. In our practice the account owner or CSM is the sender for relationship surveys, and the survey is mentioned to the customer beforehand. This is practitioner judgement, not a benchmark, so test it on your own list.
A named sender also has a legal side. Sending in someone's name to their contacts still needs a clear lawful basis and honest information about what the data is used for, which GDPR and customer feedback in B2B covers.
Lever 2: Send it when the memory is fresh
A transactional survey loses value by the hour. CustomerGauge suggests surveying about ten minutes after a phone-support case is resolved, and roughly a week after purchase in e-commerce. For B2B relationship surveys it suggests a quarterly rhythm, although another 2026 piece from the same vendor recommends twice a year. Pick the cadence by account size and contact frequency, not by whichever benchmark you read last.
Send-day and send-hour advice, such as "Tuesday to Thursday, 9 to 11", circulates widely but we could not tie it to a verifiable source, so we dropped it. Test your own list. The difference between triggers is explained in transactional vs. relational NPS, and the first 90 days of a customer relationship have their own design in the B2B onboarding survey.
Lever 3: Keep it under two minutes
CustomerGauge advises that an NPS survey should take no more than two minutes, with two to six questions as the sweet spot. Treat that as a ceiling. Our test for every question is whether a named person will act on the answer. If nobody will, delete it. If the answer already sits in your CRM, delete it too.
Design for a phone screen, because B2B contacts open invitations between meetings. The ten rules in survey design best practices cover wording, scales and question order.
Lever 4: One reminder, not three
CustomerGauge's reminder example is the cleanest number in this field: 21% respond to the first send and 13% to a reminder about a week later, so 34% in total. CustomerGauge describes this as up to 50% more responses. Check the arithmetic and it does not match: 13 extra points on a base of 21 is about 62% more, not 50%. Use the example, not the 50%.
The same page is blunt about what comes next: "it's not smart to send second or third reminders." More reminders add few responses and increase unsubscribes. One reminder, a week after the first send, to those who have not opened or answered.
- First send21%
- Reminder13%
- Total34%
Lever 5: Show what happened to the last answer
People answer again when the last answer visibly led somewhere. CustomerGauge advises replying to every respondent, not only detractors, and replying to detractors within 48 hours. We have not found a verified number for how much this lifts the next response rate, so we do not quote one. The mechanism still holds: a customer who got a human reply has a reason to answer the next survey, and a customer who got silence does not. The method is in close the loop: the complete guide to NPS follow-up and the shorter close the loop explainer, and the hardest cases in NPS detractor recovery.
What the silent accounts are telling you
Non-response bias runs in both directions. If mostly satisfied people answer, NPS overstates your standing. If mostly irritated people answer, it understates it. You cannot know which, because you do not hear from the rest.
Silence from a single account is also a signal in itself. An account that used to answer and has stopped is a better reason to phone than a low score is, because a low score still shows engagement. This is practitioner judgement from SurveyGauge, not a benchmarked finding, but it is easy to test: take your last ten churned accounts and look at whether they answered in their final year, and whether they stopped answering before they left. Feed the result into your customer health score, and treat a silent top-20 account as an action item for the account owner, not as a missing data point. How to organise this across business units is in the voice of customer guide.
A 30-day plan
| Week | What you do | How you know it worked |
|---|---|---|
| 1 | Calculate account coverage and revenue coverage. List the top 20 accounts with zero responses in 12 months. | You have a baseline and a named list. |
| 2 | Move the sender to a named person, shorten the survey to two minutes or less, and delete every question without an owner. | The survey takes under two minutes on a phone. |
| 3 | Add one reminder a week after the first send. Add a second contact to each uncovered account. | Reminder results are measured separately from the first send. |
| 4 | Reply to every respondent. Phone the silent top accounts. Recalculate coverage. | A reply log exists and coverage has moved for the accounts on the list. |
How we approach response rates at SurveyGauge
In our advisory work we start a survey review with the account list, not the response rate. The first question is which accounts we have not heard from, and who owns each of them. The platform and the CX advisory work from the same account view, so the answer leads to a named action instead of a better-looking percentage. If you want a second pair of eyes on your numbers, book a demo or look at pricing.
Frequently asked questions
What is a good survey response rate for B2B?
There is no single good number. CustomerGauge reports an average B2B NPS response rate of 12.4%, with programmes ranging from 4.5% to 39.3%, and its 2026 Decade Edition found that 40% of programmes sit at 10% or below. A better test than the percentage is whether you have heard from the accounts that carry most of your revenue.
Is 20-30% a realistic B2B response rate?
It is a figure often quoted in B2B guides, but we could not trace it to a named, dated source, so we no longer use it. The measured figures we can name are CustomerGauge's 12.4% average and the Decade Edition distribution, where 18% of programmes reach 21-35%, 9% reach 36-50% and 8% exceed 50%.
How many reminders should I send?
One, about a week after the original invitation. CustomerGauge's example is 21% from the first send plus 13% from the reminder, 34% in total, and it advises against second or third reminders because they add few responses and raise unsubscribes.
How long should a B2B survey be?
CustomerGauge advises that an NPS survey should take no more than two minutes, with two to six questions as the sweet spot. Our own rule is stricter: keep a question only if a named person acts on the answer, and never ask for data you already hold in your CRM.
When is the best time to send a B2B survey?
Tie the send to the event, not the weekday. CustomerGauge suggests surveying about ten minutes after a phone-support case is resolved and running relationship surveys quarterly in B2B, although it recommends a twice-yearly rhythm in another 2026 piece. We found no sourced evidence for a best weekday or hour, so test it on your own list.
Should I offer incentives to raise the response rate?
We found no verified benchmark for incentives in B2B, so we do not quote an uplift. Incentives can change who answers, and a gift to a customer employee may conflict with their procurement or anti-bribery policy. In B2B, a visible reply to earlier answers is usually the better reason to respond.
How do I avoid survey fatigue in B2B?
Control frequency per account, not per mailing list, so one account's contacts are not hit by three different surveys in a month. Keep surveys short, suppress contacts who just answered, and show what changed after the last round. Our guide to voice of customer programmes covers how to coordinate surveys across teams.

Written by
SurveyGauge Team
The advisors and developers behind SurveyGauge. We run customer satisfaction programmes for B2B companies, from 20 key accounts to global banks.