TL;DR
- Customer satisfaction drives B2B revenue through three channels finance can check: whether accounts renew, how much they spend inside the account, and whether they refer others. The evidence for each is real, but most of it is correlation.
- Only 4.5% of B2B CX programmes have quantified and reported their financial impact, and 74% cannot state their revenue impact at all (CustomerGauge, NPS Benchmark Report: Decade Edition, 340 programmes, 2026).
- Build the case on revenue at risk in named Detractor accounts and a 90-day pilot on your own accounts, not on an average NPS-to-growth correlation.
- Counterintuitive: the strongest external benchmark in your deck is weaker evidence than the smallest result from your own accounts, so keep the Dell numbers in a footnote and put your own pilot on the slide.
Contents8 sections
Does customer satisfaction drive revenue in B2B?
Yes, but not in the way most business cases claim. Customer satisfaction affects revenue through three channels: whether accounts renew, how much they spend inside the account, and whether they refer others. Each channel can be measured. Very few B2B teams measure any of them. CustomerGauge's NPS Benchmark Report: Decade Edition (340 B2B CX programmes, fieldwork in summer 2026) found that only 4.5% have quantified and reported the financial impact of their programme, and 74% cannot state their revenue impact at all.
That gap, not a shortage of research, is why CX budgets get questioned. Your CFO does not doubt that satisfied customers are good for business. Your CFO doubts that you can show how much, in which accounts, and by when. This article separates the evidence worth citing from the evidence to leave out, then gives you three calculations and a 90-day pilot built on your own numbers.
What the evidence shows, and how strong it is
Not all evidence is equal, and finance will test the weak spots first. This is how the most cited sources hold up.
| Source | What it shows | Where it is weak |
|---|---|---|
| Bain & Company, Fred Reichheld, Dell excerpt (22 February 2006) | In Dell's consumer business in 2003, a Detractor had a net value of minus $57 against $210 for an average customer and $328 for a Promoter. Converting half of Detractors to average customers would add more than $160 million a year | One consumer company, one year, estimates built on a short e-mail survey and public data. Direction, not B2B proof |
| Bain & Company, Markey and Reichheld (23 March 2012) | In affluent retail banking, Promoters had about one third of the attrition of Detractors, gave almost 45% more of their household deposits and made nearly seven times as many positive referrals | Consumer banking, and the $9,500 value gap in the same article is a modelled estimate |
| CustomerGauge, Decade Edition (October 2026, 340 programmes) | Among programmes linked to revenue data, 46% know their revenue impact against 12% of unlinked programmes, and 34% show a positive impact against 7% | Self-reported by participating programmes, vendor survey, and question wording changed between editions, so comparisons over time are directional |
| CustomerGauge, beverage bottler case (same report) | Across about 39,000 accounts and 42,000 responses, unrescued Detractor accounts shrank 5% while rescued ones returned to par | A single client, not a sector-wide figure |
| Forrester, 2026 Global Total Experience Score (press release 9 June 2026, 375 brands) | Strong total experience went with a 2.6x revenue lift for US automotive firms and 3.8x for US retailers, through retention and enrichment | No B2B split, and a correlation across brands |
Read the table as finance will. Every row is correlation or modelling. There is no controlled B2B trial in it, and the strongest B2B data comes from the vendor's own survey. That does not make the research useless, because together it shows a consistent direction. It means you should use it to justify why the question is worth asking and never as your forecast.
- Linked to revenue data
- Not linked
- Know their revenue impact46%12%
- Show a positive revenue impact34%7%
Why fixing Detractors comes before creating Promoters
The Dell numbers contain the most useful asymmetry in this literature. Moving a Detractor to an average customer was worth $267 per customer. Moving an average customer to a Promoter was worth $118. The cheapest revenue is the revenue you stop losing.
B2B sharpens this. You have few accounts, each with a named owner and a renewal date, so a Detractor is not a statistic but a contract at risk. A Promoter strategy asks you to change how a customer feels. A Detractor strategy asks someone to call within 48 hours and agree a plan. The first is hard to attribute. The second is easy to count.
The bottler case points the same way, with a caveat that it is one client: unrescued Detractor accounts shrank 5%, and rescued ones returned to par. The value sits in the loss you avoid. Start with detractor recovery and the close-the-loop process for NPS, then treat Promoter programmes as a second phase.
- Detractor-57
- Average customer210
- Promoter328
Why a logo-weighted NPS flatters you
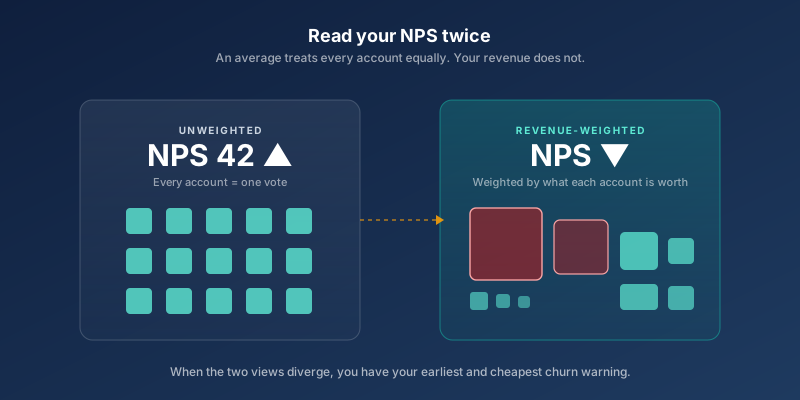
Standard NPS counts every account as one voice. Revenue does not. When your largest accounts are less satisfied than your smaller ones, which is common in account-based CX, your headline NPS overstates the health of your revenue.
Here is a hypothetical example with Nordika A/S. The numbers are illustrative, so replace them with your own.
| Segment | Accounts | Annual recurring revenue (DKK million) | Share of revenue |
|---|---|---|---|
| Promoters | 150 | 50 | 42% |
| Passives | 100 | 40 | 33% |
| Detractors | 50 | 30 | 25% |
| Total | 300 | 120 | 100% |
By account count, Nordika's NPS is 33 (150 Promoters minus 50 Detractors, out of 300). Weighted by revenue it is 17 (42% minus 25%). The first number looks healthy in a board pack. The second tells the CFO that a quarter of revenue sits in accounts that are unhappy.
Coverage matters as much as the score. CustomerGauge reports that 60% of programmes do not know what share of their revenue their feedback programme reaches, and suggests targets of 20% contact response, 40% account response and 80% revenue coverage. A score from accounts that represent 40% of revenue cannot speak for the other 60%. Choosing who to ask so the programme reaches that revenue is covered in how to measure customer satisfaction.
- Promoters42%
- Passives33%
- Detractors25%
Three calculations finance will accept
Each of these uses your numbers, not a benchmark.
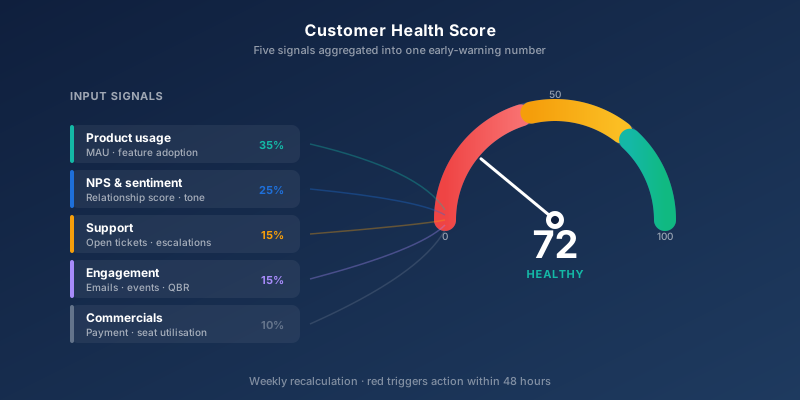
1. Revenue at risk. Take annual recurring revenue in Detractor accounts and multiply by your own historical churn rate for Detractor accounts, taken from your last two or three renewal cycles. For Nordika: DKK 30 million times 20% is DKK 6 million, or 5% of recurring revenue. This is your cost of inaction. If you cannot compute the churn rate because feedback is not linked to renewals, that is your first finding, and a customer health score is how you fix it.
2. Revenue-weighted NPS. Track it every quarter next to the standard score, as in the Nordika table. When the two diverge, your large accounts are telling a different story from your small ones.
3. Rescue value. Accounts saved times the recurring revenue of those accounts, minus what the programme cost you in time and licences. This is the number the pilot below produces. For the cost of replacement, use your own cost of winning a comparable account, not an industry multiple.
Add a driver view when leadership asks what to fix first. Key driver analysis shows which issues move scores in the accounts that matter, so the investment ask is specific.
The 90-day pilot that produces your own evidence
A pilot is the one piece of evidence nobody can dismiss as someone else's data.
- Identify Detractor accounts from your latest relationship survey and attach recurring revenue and renewal date to each.
- Split them into two groups. One gets the full response: a named owner contacts the account within 48 hours and agrees a plan within two weeks. The other follows your normal process. If you cannot withhold attention from key accounts, use last year's Detractor cohort as the comparison instead.
- Track contract revenue for both groups for 90 days, and then through the next renewal date.
- Report revenue retained, not only accounts retained, and subtract programme cost.
Nordika example: 50 Detractor accounts at about DKK 600,000 each, 25 in each group. Five accounts are lost in the comparison group (20%) and three in the response group (12%). Two accounts times DKK 600,000 is DKK 1.2 million in retained revenue.
Be honest about what that proves. Two accounts out of 25 per group is not statistically significant. Present it as a directional result, say so before finance does, and read B2B survey sampling with a small n before you set the group sizes. Credibility comes from the method being visible, not from a large number.
Why most CX business cases fail
Three patterns repeat. The case leans on borrowed numbers such as the Dell study instead of the company's own accounts. It has no baseline, so there is nothing to compare against. And finance did not co-sign the number, so it is treated as marketing's estimate.
The fix for the third is ownership. Agree with finance up front which revenue figure counts, how churn is defined, and who signs off the result. CX governance explains who should own that number. The same logic sits behind Retention as a Service, where a vendor is measured on kept customers and not on licences. For a sense of where your score stands before you build the case, see the NPS benchmarks for 2026, and for fixing the churn itself see how to reduce churn.
How SurveyGauge supports the case
The platform maps each account to recurring revenue and renewal date, so you can see the revenue-weighted score and revenue coverage next to the standard NPS, and route every Detractor to a named owner with a deadline. The advisory side helps you design the pilot, agree definitions with finance and read the result. You get the numbers and the person who knows how to defend them.
Frequently asked questions
Does customer satisfaction increase revenue in B2B?
Yes, through renewals, spend inside existing accounts and referrals, but the proof is mostly correlation, not controlled trials. Programmes that link feedback to revenue data are far more likely to know their impact: 46% of linked programmes can state it against 12% of unlinked ones (CustomerGauge, Decade Edition, 2026). The reliable way to prove the effect in your own business is a pilot on your own Detractor accounts.
How do I calculate the revenue impact of NPS?
Start with annual recurring revenue in Detractor accounts and multiply it by your own historical churn rate for such accounts. That gives revenue at risk, which is the cost of doing nothing. Then track a revenue-weighted NPS next to the standard one, because large accounts often score differently from small ones.
Is it better to fix Detractors or create Promoters?
Fix Detractors first. In Bain's Dell analysis from 2003, moving a Detractor to an average customer was worth $267 per customer, while moving an average customer to a Promoter was worth $118. That is one consumer company, so treat it as direction, then confirm it with your own pilot.
How many accounts does a CX pilot need to be credible?
Fewer than most people hope. With 25 accounts per group, a difference of two accounts is not statistically significant, so present the result as directional, report revenue rather than counts, and follow the accounts to their next renewal date. See the article on B2B survey sampling with a small n.
Which statistics should I avoid in a CFO presentation?
Avoid any number you cannot trace to a named, dated source with a stated method, and any figure from a different industry presented as if it applied to you. Also avoid mixing studies that look alike, such as Forrester's 2025 and 2026 total experience releases or several CustomerGauge reports.
How long does it take to see ROI from a CX programme?
The first measurable result appears at the next renewal date of the accounts you rescued, so the timeline follows your contract cycle, not the survey cycle. A 90-day pilot shows early signals such as contact made and plans agreed, and the revenue result comes when those accounts renew.

Written by
SurveyGauge Team
The advisors and developers behind SurveyGauge. We run customer satisfaction programmes for B2B companies, from 20 key accounts to global banks.