TL;DR
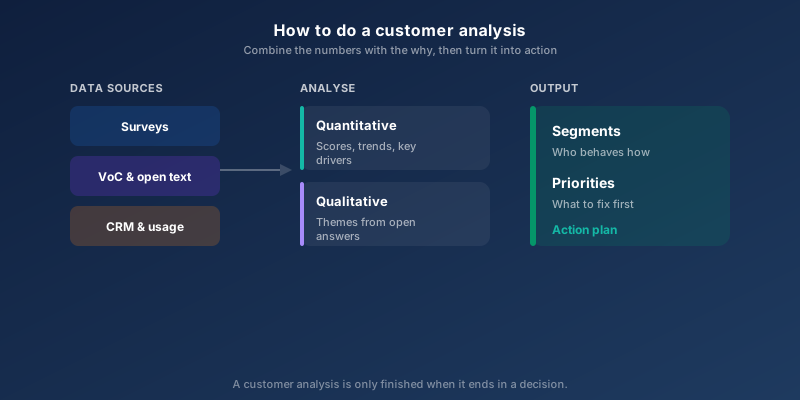
- Open-ended responses are the richest data source in your VoC programme, but only if you treat them systematically
- Without a coding framework, analysis degenerates into subjective cherry-picking
- In particular, sentiment analysis only delivers value when you tie it to specific topics
- A prioritisation matrix forces you to separate signal from noise, and that is the step most teams skip
Contents7 sections
Open-ended responses are gold most organisations leave on the table
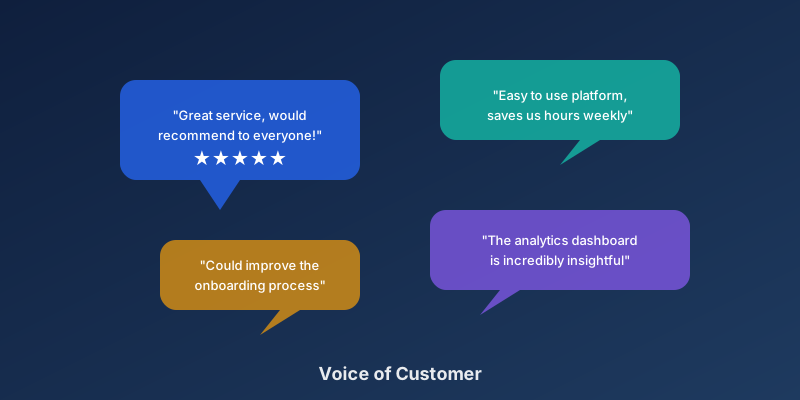
"Your return process is a maze. I spent 40 minutes trying to figure out how to return my package, and in the end I gave up."
That single response tells you more than a thousand 1-5 scores ever could. It is specific. It is contextual. Moreover, it points directly to what needs fixing.
Yet across the organisations we work with, open-ended responses remain the most neglected data source in VoC programmes. The numbers land in a dashboard within hours. The free text ends up in a spreadsheet nobody opens. Indeed, the reason is straightforward: free text demands a method, and most teams do not have one.
Here is the approach we recommend when you want to move from raw text to insight your organisation actually acts on.
Part 1: Build a coding framework before you open the dataset
The mistake we see most often is someone diving straight into the responses without a system. As a result, they remember the most dramatic quotes and present them as "what customers are saying." That is anecdote, not analysis.
A coding framework is a hierarchy of categories that lets you aggregate individual responses into patterns. For a retail business, it might look like this:
- Product: Quality, range, price
- Staff: Helpfulness, knowledge, availability
- Physical store: Layout, cleanliness, signage
- Checkout/payment: Wait time, payment methods
- Returns/complaints: Process, speed, communication
- Delivery (online): Delivery time, packaging, tracking
- Communication: Emails, campaigns, notifications
How to build it in practice:
- Read 50-100 responses manually. Not to analyse, but to spot recurring topics
- Define 6-12 top-level categories based on what you see
- Add subcategories only where volume and variation justify it
- Write a short definition and example for each category
That last point is critical. For example, we regularly see two analysts code the same response differently because the categories were not defined precisely enough. The definition eliminates the guesswork.
Core coding principles:
- Code what the customer says, not what you think they mean
- Use neutral language in category names
- Ambiguous cases go to "Not codable" rather than being guessed into a category
Part 2: Choose your categorisation strategy
With a framework in place, you then need to decide how to code the responses. There are three approaches, and the choice depends primarily on volume.
Manual categorisation (50-300 responses) An analyst reads each response and assigns categories. Consequently, this gives high precision and catches irony and context. The trade-off is time, and there is a risk of analyst bias. In practice, it is the right starting point for most organisations.
Semi-automated categorisation (300-1,000 responses) You define keywords for each category ("wait, queue, checkout, slow" -> "Checkout/payment") and let the system produce a first draft that an analyst validates. Significantly faster, but misses responses without explicit keywords.
AI-based categorisation (1,000+ responses) Large language models can categorise responses based on a prompt describing your categories and examples. It scales well and handles context better than keyword matching. However, it requires solid prompt engineering and sample validation. Our experience is that AI misunderstands industry-specific terminology more often than vendors promise. For a sharper, product-angled follow-up on what this technology should actually deliver in B2B, from tagging to account-weighted routing, see AI text analytics for customer feedback.
Part 3: Sentiment analysis that is actually useful
Sentiment analysis classifies a response as positive, negative, or neutral. That sounds helpful, but in practice, however, binary sentiment is nearly useless on its own.
Take a response like: "The product is fantastic, but the delivery took forever." That is positive about the product and negative about delivery. Binary sentiment calls it "mixed" and misses the entire point.
Topic-level sentiment is what you need. Not just "negative response," but "negative about category: Delivery." In turn, this gives you a multi-dimensional picture of what is working and what is not.
Part 4: The prioritisation matrix, so you act on the right things
You now have a quantified picture of what customers are saying. Instead, the important question is not "what comes up most?" but "what should we tackle first?"
Plot your themes in a prioritisation matrix:
- X-axis: Frequency - how many responses mention this theme?
- Y-axis: Impact - what is the average NPS or CSAT difference for customers who mention this theme?
Themes in the upper right corner (high frequency + high negative impact) are your top priorities.
Add a third dimension: ease of resolution. High-impact, high-frequency themes that are relatively straightforward to fix should be addressed immediately. Complex ones go into a roadmap with clear owners.
Part 5: A realistic monthly workflow
Here is the workflow we recommend for a monthly cycle with roughly 300 open-ended NPS responses. It has been tested across several organisations we work with, and it balances thoroughness with practical feasibility.
Days 1-3: Coding
- Export all open-ended responses from your survey platform
- Clean data: remove blanks, very short responses (under 5 words), and irrelevant entries
- Code each response with category(ies) and sentiment
- Calculate frequency per category
Days 4-5: Analysis
- Identify the top 5 negative and top 5 positive themes
- Run the prioritisation matrix: cross-tabulate frequency with NPS impact
- Select 3-5 representative quotes per top theme (anonymised)
Week 2: Presentation and action planning
- Present findings in a one-page briefing: top insights, prioritisation matrix, recommended actions
- Facilitate an action planning session with relevant process and product owners
- Document decisions: who owns what, by when, and what does success look like?
From analysis to organisational muscle
Analysing open-ended responses is not a technical project. It is an organisational habit. The goal is not the perfect analysis. It is a system that continuously translates the customer's voice into improvements, the way Autorola Group has done with their VoC programme.
Start simple. Define a clear framework. Code consistently. Present clearly. And make sure the analysis leads to concrete actions with named owners and deadlines.
That is where the value is created. Everything else is reporting.
Frequently asked questions
When is it worth analysing open-ended responses manually vs. with AI?
Below 200 responses per cycle, a skilled analyst can handle it manually and will catch nuances AI misses. However, above 500, AI-based categorisation saves significant time. Nevertheless, regardless of volume, human validation is essential. AI misses irony, jargon, and contextual references more often than most vendors admit.
How many categories should my coding framework have?
6-10 top-level categories is the right starting point. More than that and you lose consistency between cycles. For example, the typical mistake is defining 20+ categories in an initial burst of enthusiasm. Nobody can tell them apart two rounds later. Instead, keep it simple and revise after your first few cycles.
How do I handle responses that cover multiple topics?
Use multi-tagging so one response can belong to two or three categories. Additionally, always define a primary category based on the dominant theme. In practice, multi-topic responses tend to make up 10-15% of a dataset. Consequently, if you do not handle them consistently, they will distort your frequency counts.
What is the most common mistake in analysing open-ended responses?
Confirmation bias. It happens when the analyst unconsciously sorts responses into categories that confirm what the organisation already believes. The antidote is to define categories and coding criteria before opening the dataset. Have two independent coders work through a subset to test consistency.
What do I do with responses that are unclear or very short?
Short, unambiguous responses like 'too expensive' or 'slow delivery' can be coded directly. Unclear responses get marked as 'Not codable' and excluded from quantitative analysis. Define a minimum standard upfront and stick to it. It is tempting to over-interpret a vague response, but that contaminates your data.

Written by
SurveyGauge Team
The advisors and developers behind SurveyGauge. We run customer satisfaction programmes for B2B companies, from 20 key accounts to global banks.